#1 NAFTA – Autos and Dairy, or Bust
The renegotiation of the North American Free Trade Agreement will be an almost weekly fact-of-life during the fourth quarter. There is a general consensus that talks need to be completed by the end of the year in order for the U.S. to sign a deal (which it can do in March at the earliest) before the Mexican elections. Yet, there is still “an enormous amount of work to be done” (according to U.S. Trade Representative Robert Lighthizer) and there is a risk that they run into next year (per Mexican Economics Minister Ildefonso Guajardo).
Given the U.S. preoccupation with the trade deficit, significant increases in U.S. exports are needed without resulting in significant cuts in imports from Canada or Mexico. Agriculture is one area to be addressed, with Canada only accounting for 2.3% of U.S. beans and grains exports – Panjiva data shows – vs. 12.0% for Mexico. Canada in the meantime has taken a more hawkish stance due to U.S. actions on softwood lumber and aerospace trade cases.
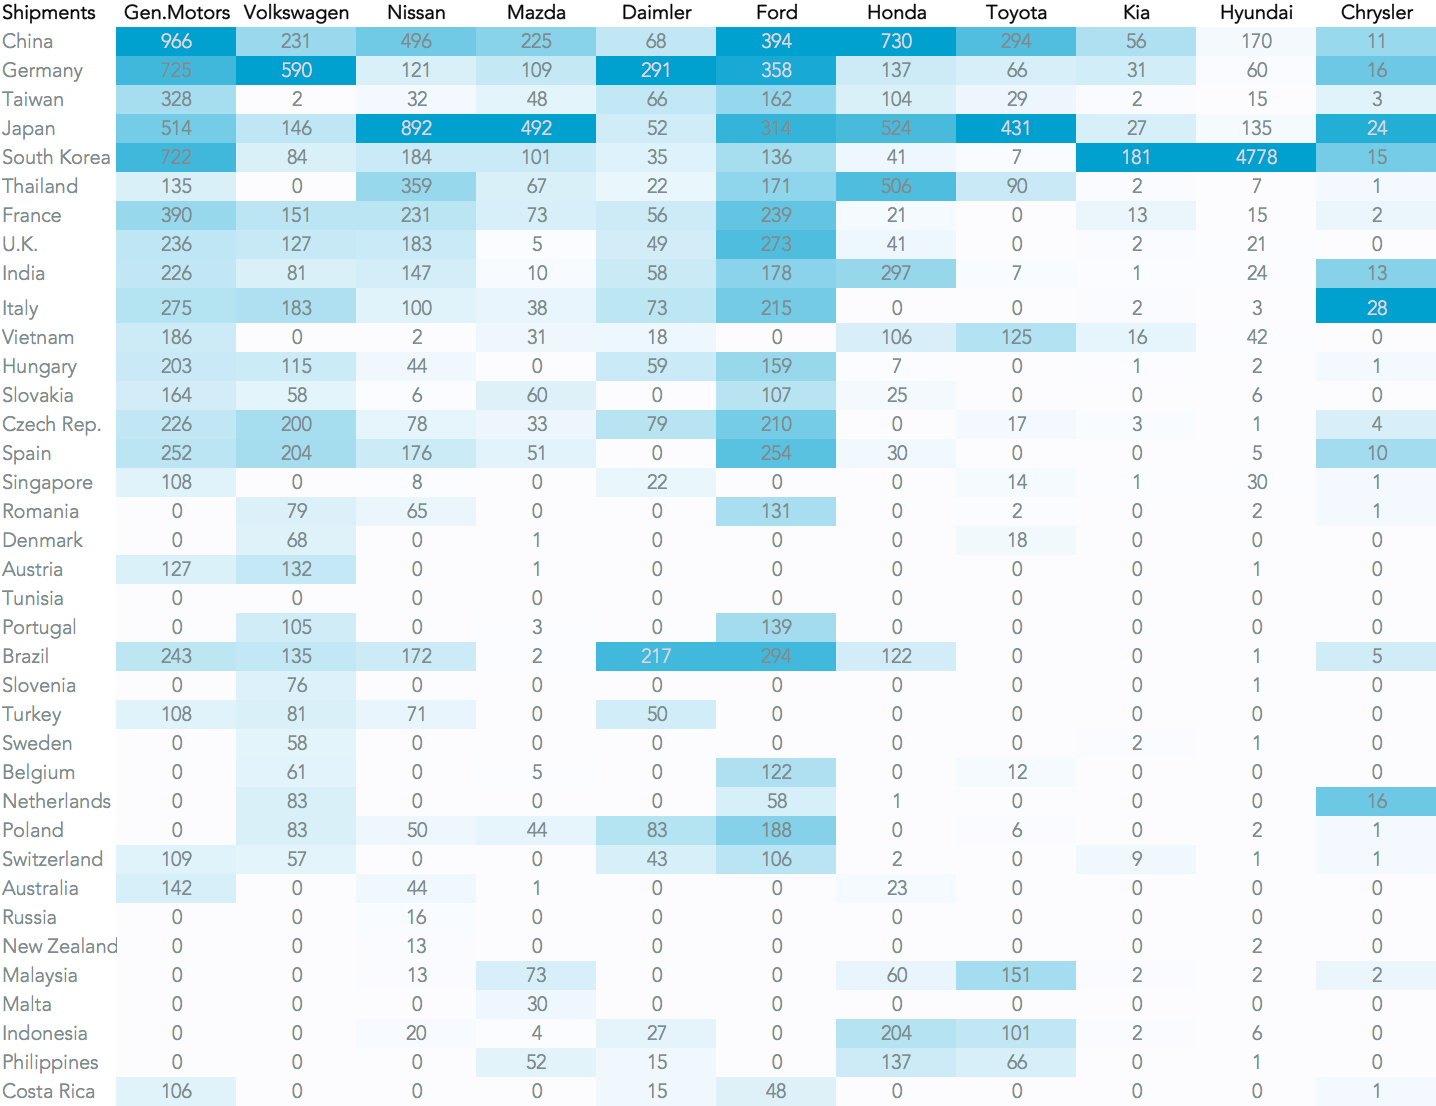
Another, arguably more significant, area is automotive rules of origin. While there is controversy about their effectiveness, the fact is that automotive industry accounted for 87.8% of the U.S. trade deficit in the past year. Increasing the U.S. share of inputs to Mexican factories – displacing parts from other countries – is a significant potential lever. It’s yet to be addressed in talks however, and is the main topic area to watch. Panjiva analysis of 1,150 country-product pairs shows imports from South Korea (Hyundai), China (GM) and Japan (Nissan and Toyota) are all potential areas for action.
Source: Panjiva
#2 China vs. U.S. – Lots of Chances to Get It Right and Wrong
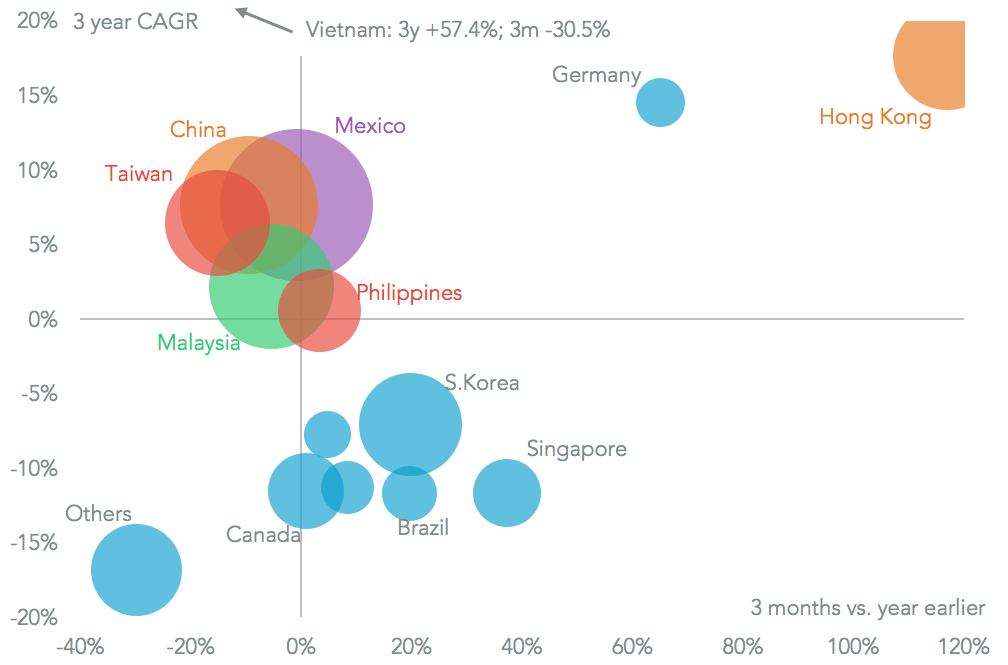
The largest trade relationship in the world could go through considerable upheaval in the fourth quarter. The U.S. is scheduled to complete its section 301 review of Chinese intellectual property practices, which could give President Trump significant tariff-setting powers. Initial hearings on October 10 come ahead of a proposed visit in November by the President to China, where he will want to show both tough action and progress on the Comprehensive Economic Dialogue. Both may be overtaken by a review of the White House’s broader review of its China policy, Politico reports.
China in the meantime will be internally focussed with the five yearly Party Congress from October 18 and may therefore be in no mood to give easy concessions. One solution may be for the Trump administration to slow the section 301 review, as it has done with the section 232 reviews on metals (see below). China’s main aim appears to be increasing its imports of high technology products from the U.S. Finding ways to boost U.S. semiconductor exports, which expanded by just 2.8% on a year earlier in are a logical area for development. U.S. suppliers currently only account for 3.3% of Chinese imports.
Source: Panjiva
#3 KORUS – Lighthizer-nomics 101
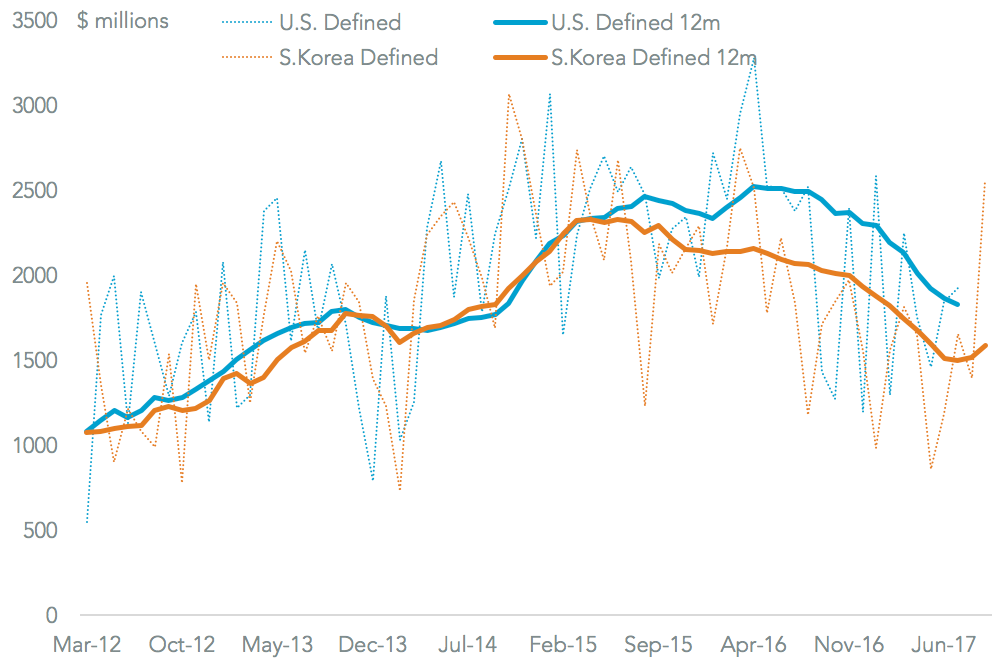
The governments of South Korea and the U.S. will investigate ways to reform the KORUS trade deal, with initial talks on October 4 needing to address differences of opinion on the trade deficit the U.S. holds with South Korea. The U.S. both wants to make it the center of talks, while also insisting on higher figures that South Korea has assessed. South Korea in the meantime wants to investigate the causes first. As of July the U.S. assessment of its deficit ( exports less imports) was 22.1% higher than South Korea’s (based on government data). While the deficit had been shrinking until then, South Korea data shows it has started to rise again and is nearly 3x its May trough in September.
The deal is important in that it will show whether the Trump administration – with talks led by Ambassador Lighthizer – is really willing to walk away from deals where its objective of cutting deficits is not met. It’s also worth noting that the results of the prior “Omnibus Review” of the causes of the trade deficit (due at the end of June but yet to be published) and a review of the performance of trade deals (due October 29) should form the basis of the talks with South Korea. As with the NAFTA talks, the automotive industry is likely to be an area of focus.
Source: Panjiva
#4 Steel, Aluminum, Panels and Washers – Big Cases Still Wide Open
As well as “macro-policy” matters, the Trump administration also has several non-standard trade cases running in the section 232 “national security” reviews of the steel and aluminum industries and section 201 “safeguarding” reviews of solar panels and residential washing machines. The section 232 reviews have essentially been “parked” until tax reform has been passed, CNBC reports. – there are Senators whose districts could “lose” if tariffs are too high (and steel costs go up, hurting manufacturing) or if they are not implemented (further steel job losses).
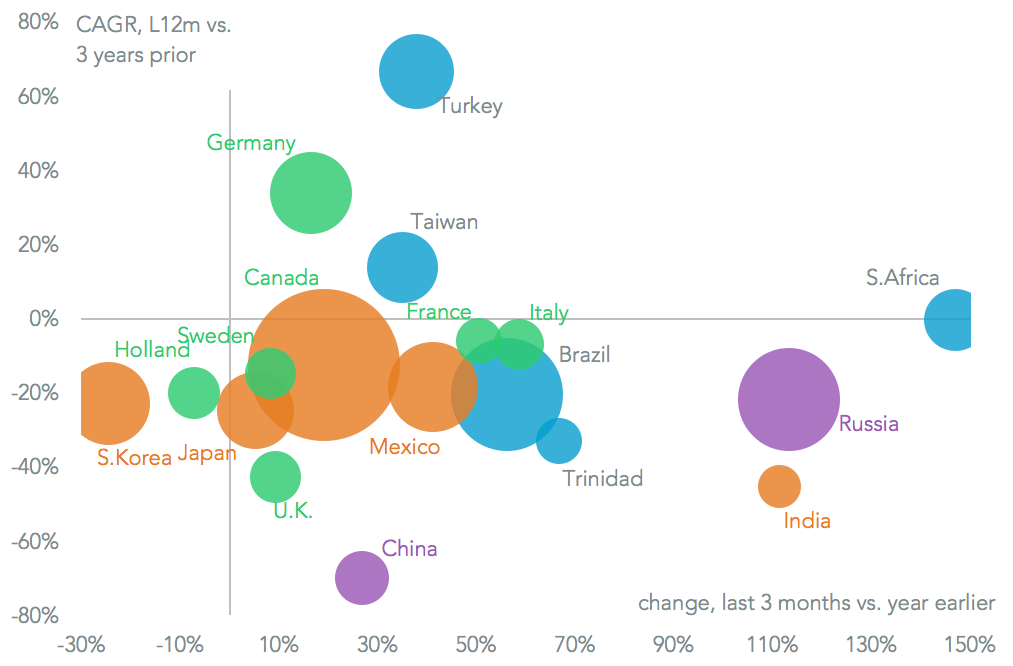
While these cases are reviewed imports of the products under review continue to rise. Panjiva data shows imports of steel broadly have increased by 27.0% on a year earlier in the three months to July 31, while shipments of aluminum have increased 26.0%. Ironically the fastest growth in imports are from countries that the U.S. has difficult relations with including China (26.8% growth in steel shipments) and Russia (113.4%).
Imports of washing machines have fallen 8.6% and solar cells by 41.6% over the same period, though those reviews are more traditional – with a defined timeline.
Source: Panjiva
#5 Global Trade Talks – All Shall Have Deals (Or Progress On Them)
One response from the global trade community to the more protectionist stance taken in the U.S. has been an acceleration of deal talks by other nations and regions. There are several ongoing discussions where governments are hopeful of reaching deals this year, including between Mexico and the EU.
However, the most advanced example is the European Union’s deal with Japan (EPA) which reached a provisional agreement in July with hopes of a finalization by year end. However, the recent announcement of elections in Japan on October 22 may derail this. They may also present a challenge for the Trans-Pacific Partnership – governments are relying on a late-November heads-of-state meeting to strike a deal, Associated Press reports.
Progress on developing the Regional Comprehensive Economic Partnership (RCEP) has slowed, and now appears unlikely to reach a completion this year despite a rapprochement between India and China. One area that looks unlikely to make progress is a “post-Brexit” trade deal between the EU and the U.K. with a decision due at an EU summit on October 19.
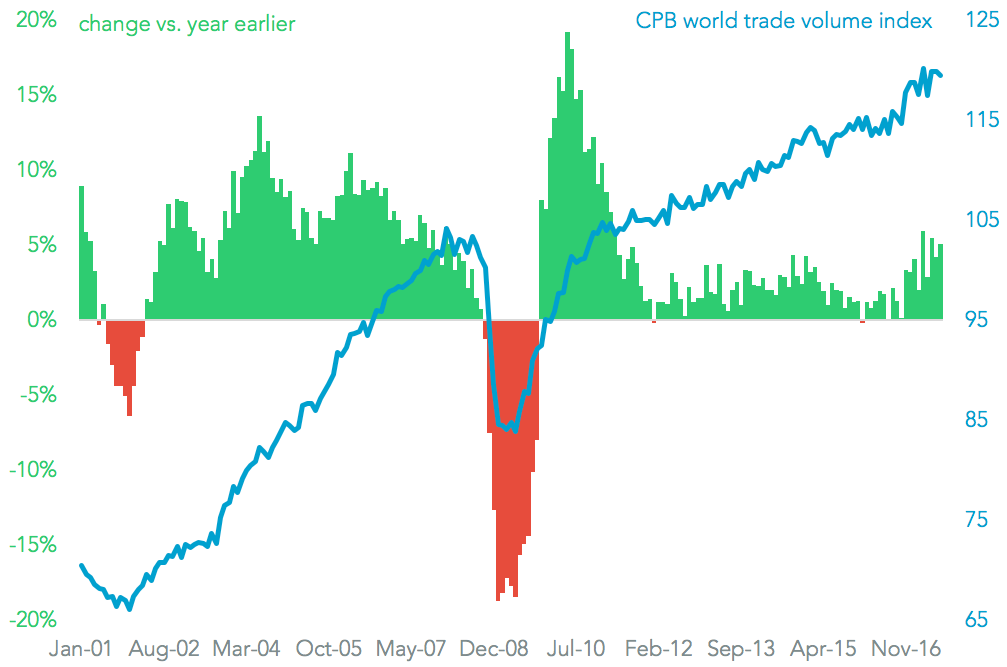
However, global trade remains robust – with 18 straight months of growth culminating in a 5.1% expansion on year earlier in July – reducing the economic “need” for deals. Manager surveys also suggest an expectation that growth continues.
Also, until the Trump administration takes actively hostile measures there may not be enough impetus for these various trade deals to reach a rapid conclusion.
Source: Panjiva
#6 Container Industry – The Bad Times Might Be Back
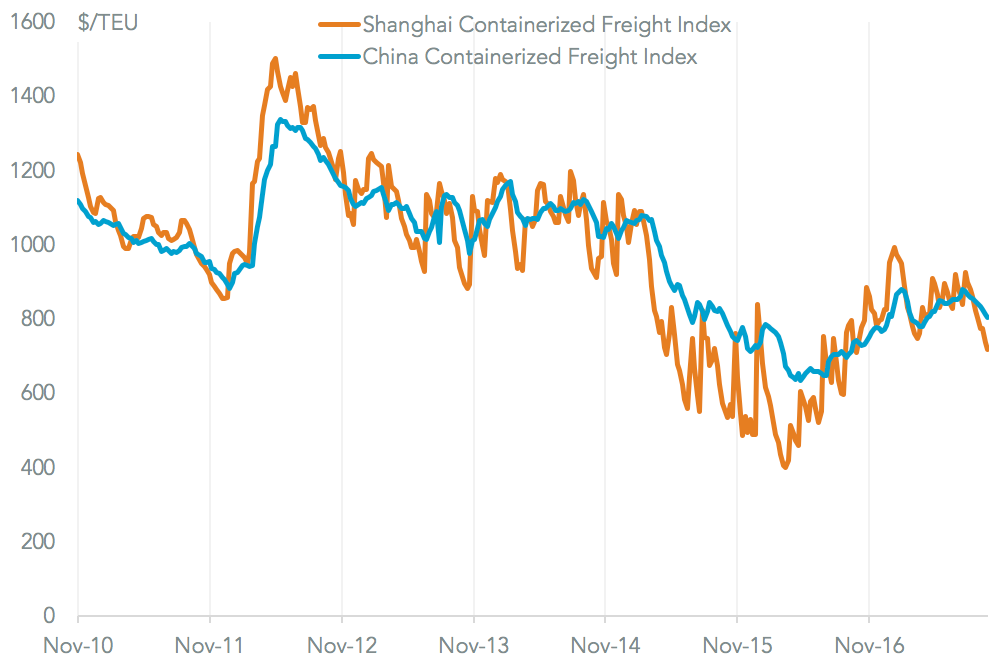
The container-line industry reached its nadir in the third quarter of 2016 with the financial failure of Hanjin Shipping on August 31 2016. That had followed a steady slide in rates that saw a drop from an average $1,430 per TEU in the second quarter of 2012 to $700 per TEU in the third quarter of 2016 – a 51.4% drop – SSE data for China-outbound rates shows.
The winding up of Hanjin Shipping took until February, and was accompanied by a 24.0% recovery in rates to their first quarter peak. Subsequently, however, rates have taken a downturn once more, falling for 10 of the past 13 weeks. The proximate reason for this is difficult to discern – there is often volatility during the peak shipping season when there is congestion (for example in Europe currently or previously in Shanghai) or disruptions ( hurricanes in the Gulf of Mexico and the Pacific basin).
However, a return to new shipbuilding orders raises concerns that a race for scale has returned. An increase in capacity – particularly for larger vessels as shown by recent orders from CMA-CGM and MSC for a total of twenty 22,000 TEU vessels – runs the risk of running ahead of the demand discussed above. Commentary from management teams at the forthcoming third quarter results reporting season will be instructive as to where rates will go next.
One curve-ball that may come back to hit the industry – nothing has yet publicly come from a U.S. Department of Justice set of subpoenas of the “ Box Club” which has previously acted as a talking shop for the industry.
Source: Panjiva
#7 Shipping Consolidation – Getting Deals Done Harder Than Launching Them
The failure of Hanjin Shipping arguably also pushed shippers towards a phase of “large-buys-large” consolidation to improve efficiency and – presumably – build pricing power. There are three large deals underway, two of which should complete by the year end. The three-way merger of the Japanese shippers’ (Mitsui OSK, K-Line and NYK) container operations to form ONE has now received most but not all of its necessary regulatory approvals. It appears relatively uncontroversial given the EU’s unconditional approval. Maersk’s purchase of Hamburg Sud mostly impacts upon southern American routes, and required modest disposals in the cabotage business.
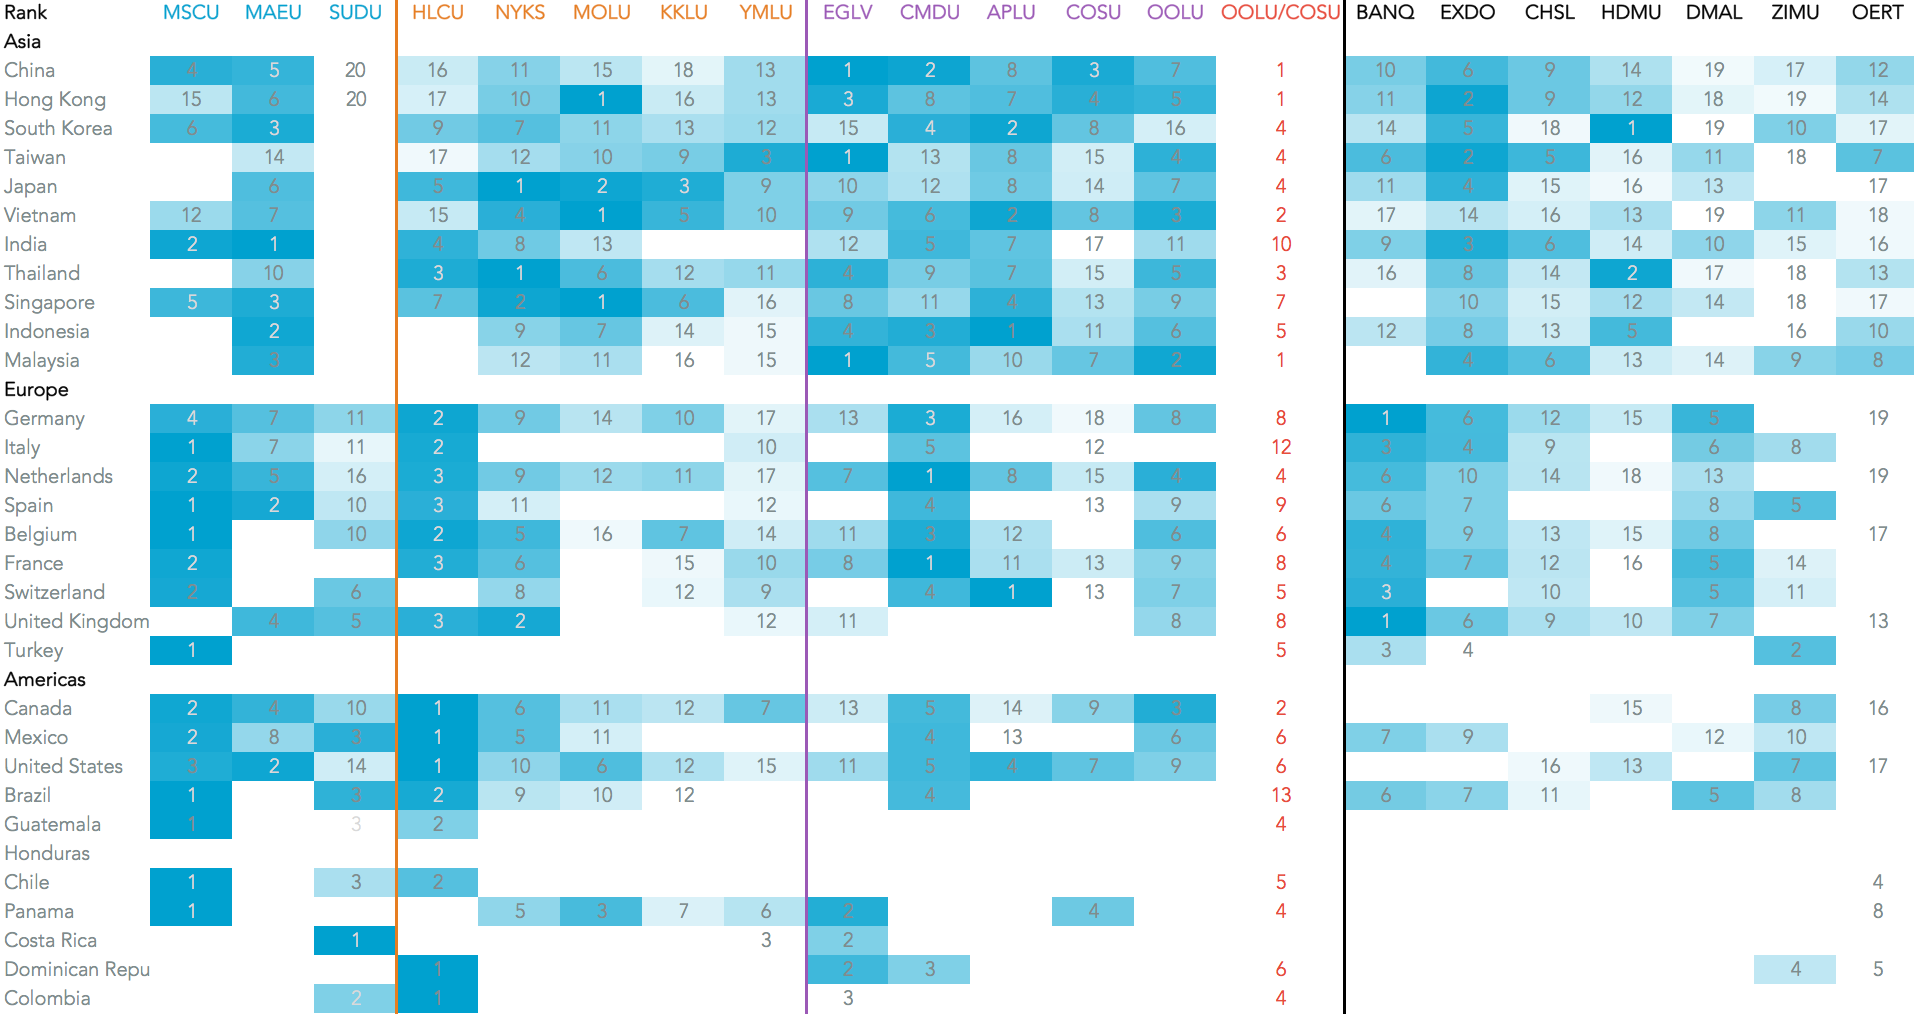
The most recently launched deal – COSCO Shipping’s purchase of Orient Overseas – may not be as lucky. One complication is that the acquisition of port assets in the U.S. embedded in Orient Overseas will require CFIUS approval, which could be difficult in the current political environment. It will also face continued Congressional concerns about consolidation in the industry. Panjiva analysis of over 4,000 carrier-country pairs shows the combined entity would be number one on three major U.S.-bound lanes including China, Hong Kong and Malaysia, as well as top three on Vietnam and Thailand which are seeing significant freight growth.
Source: Panjiva
#8 Supply Chain Management – Dealing with Disasters
The weather has brought a great many challenges for the logistics industry in the past three months with monsoons in India, typhoons in the Indian Ocean and western Pacific and hurricanes (and earthquakes) in the Gulf of Mexico. While these are all annual occurrences this year’s events have raised questions about the resilience of trade infrastructure – including inland logistics as seen in Puerto Rico’s devastation.
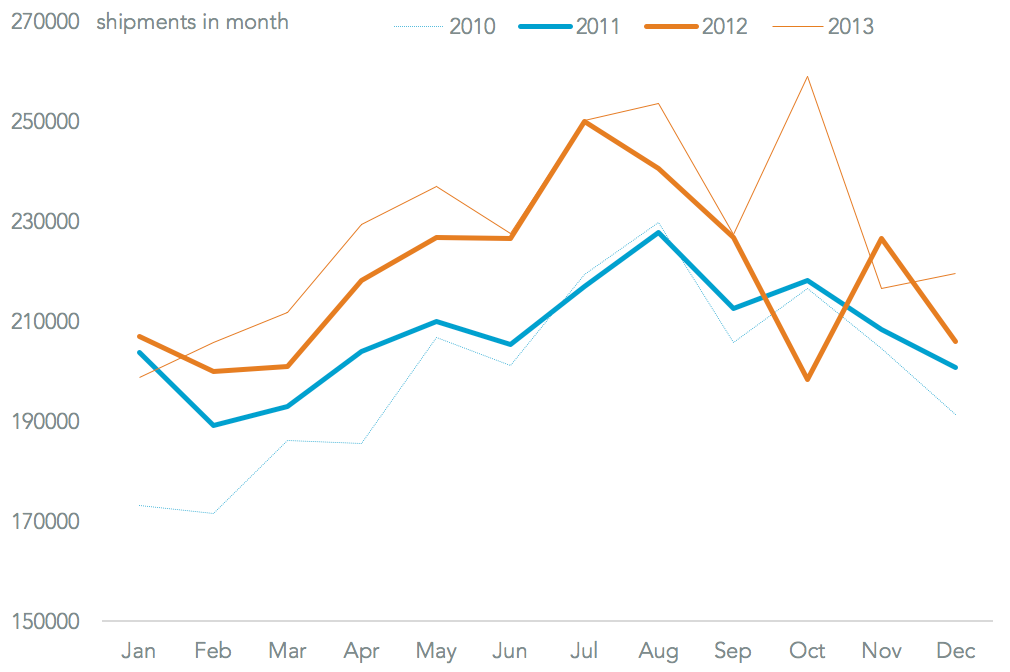
The storm season has a few weeks left to run, while Superstorm Sandy in October 2012 shows winter weather events cannot be ruled out. Disruptions to eastern seaboard shipping were equivalent to as much as 9% of handling for the entire month. The impact on ports and carriers of recent events, and there plans for future investments will only become clear during the rest of the year.
Source: Panjiva
