 En
EnArguably the most significant piece of trade policy, and the one that is least likely to change because of the midterms’ results, is the escalating tariff war with China. Panjiva data for U.S. imports and exports shows that U.S. trade with China accounted for 16.1% of total trade in the 12 months to Sept. 30, making it the third largest counterparty after Mexico / Canada and the European Union.
As outlined in Panjiva research of Oct. 25 bilateral tariffs applied under the section 301 process covered $360 billion of trade as at the end of September at rates of between 5% and 25%. Short of radical changes to underlying legislation it is difficult to see how Congress can easily remove the President’s power to continue prosecuting the trade war.
A rapid decline in U.S. exports to China, and resulting economic downturn, could change the Senate calculus of course. With all that said, the forthcoming summit meeting between President Trump and President Xi, scheduled for Dec. 1, will be more important.

Source: Panjiva
An approval of the U.S.-Mexico-Canada Agreement (aka NAFTA) will likely be put to Congress in the new year. Under Trade Promotion Authority both houses can only either approve or reject the deal. The Trans-Pacific Partnership deal brought by the Obama administration in similar circumstances was successfully blocked by the Republicans.
However, President Trump has repeatedly indicated that he would be willing to withdraw from NAFTA under the right circumstances. House Democrats therefore run the risk that blocking the deal may result in greatly expanded economic uncertainty. Additionally the labor-friendly terms embedded in some of the rules of origin will be attractive to many Democrats.
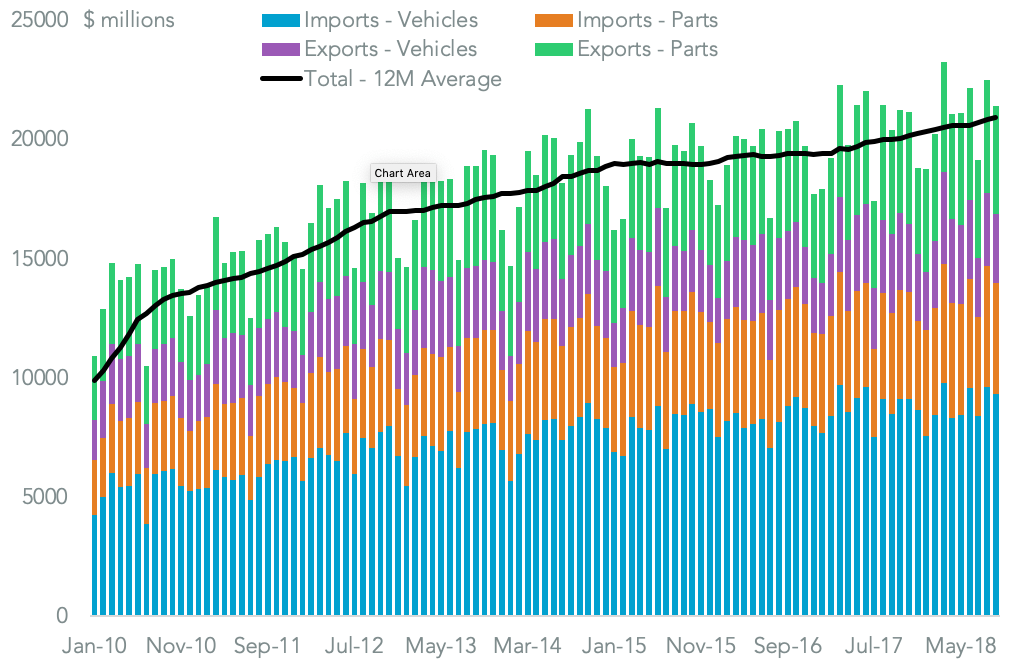
Should USMCA passage be blocked or delayed though the greatest uncertainty would likely way on the automotive industry (parts and vehicles). In total the industry accounted for 20.6%, or $251.0 billion of America’s bilateral trade with Canada and Mexico in the 12 months to Sept. 30.
Source: Panjiva
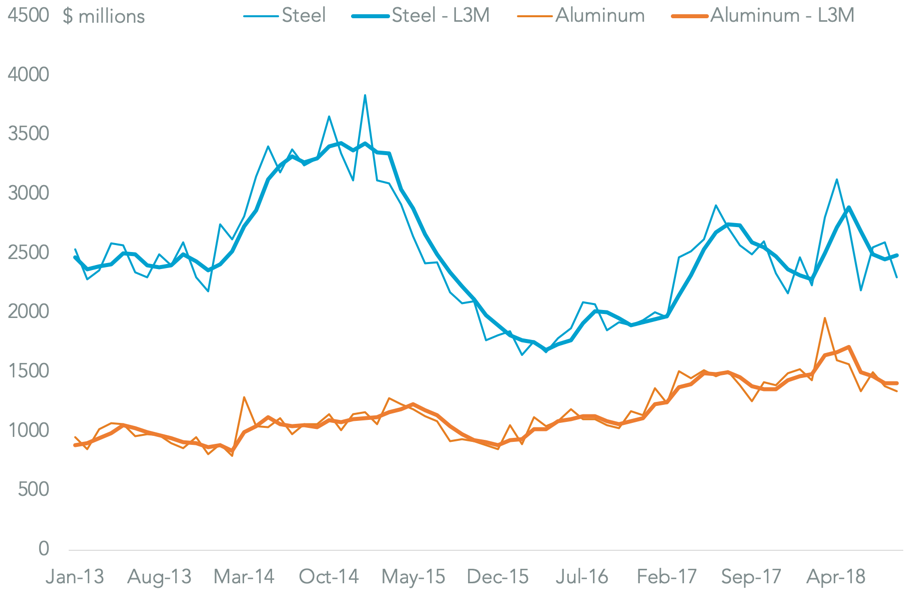
The automotive sector already faces uncertainties from the section 232, “national security” review of the industry. The application of duties under a similar scheme has had only a marginal impact on the steel and aluminum sectors – U.S. imports fell by just 7.0% in dollar terms vs. the second quarter and by just 1.7% vs. the first quarter.
The automotive sector review has proven more controversial however – it isn’t clear what the national security issues around automotive industry are. While the makeup of the House Ways & Means Committee (which covers taxes and tariffs) will change, and could be more hostile, new legislation seems unlikely.
Several bills to restrain the President’s use of section 232 have been introduced in the current term, but none have made much progress. It’s difficult to see any making progress in the next Congressional term given a veto-proof majority (two thirds of votes in the Senate) would be needed.
Source: Panjiva
The section 232 review is also hanging over the administration’s putative trade negotiations with Japan and the EU. Assuming the TPA rules are followed the main impact of the change in control of the House may be an insistence from Democrats on the imposition of strict labor standards in new trade deals.
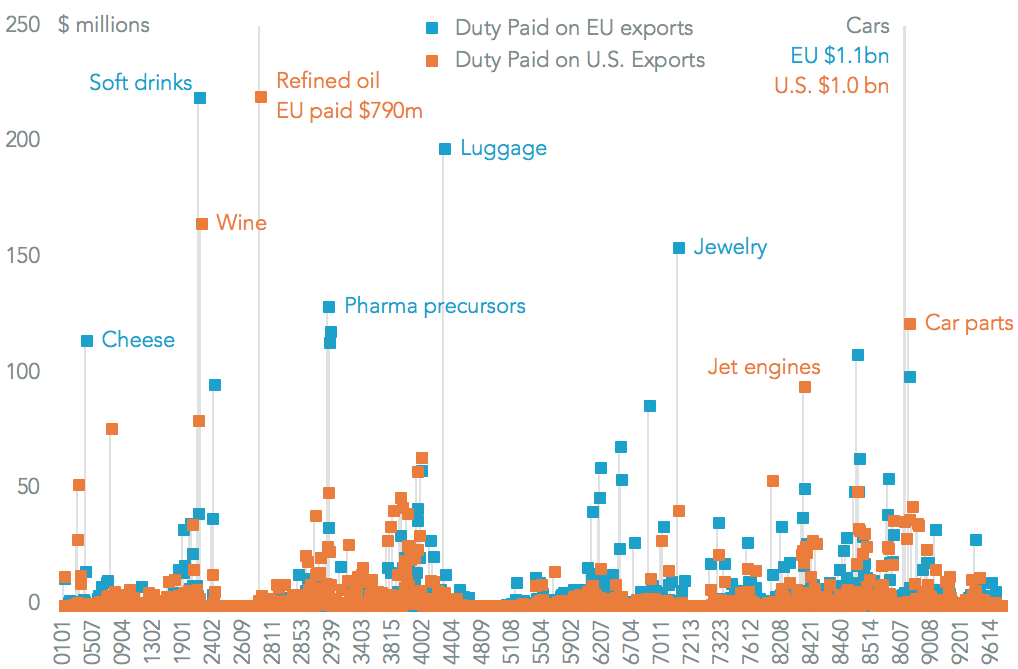
Trade deals with the EU and Japan will likely focus more on standards and non-tariff barriers than tariffs. Yet, there are still significant wins available with $12.4 billion of bilateral tariffs with the EU and $4.1 billion with Japan. In any event those deals will take years rather than months to negotiate and so may be a matter for after the next elections in 2020.
Source: Panjiva
This report was first published as Panjiva Research on November 7. To learn more visit panjiva.com/research.
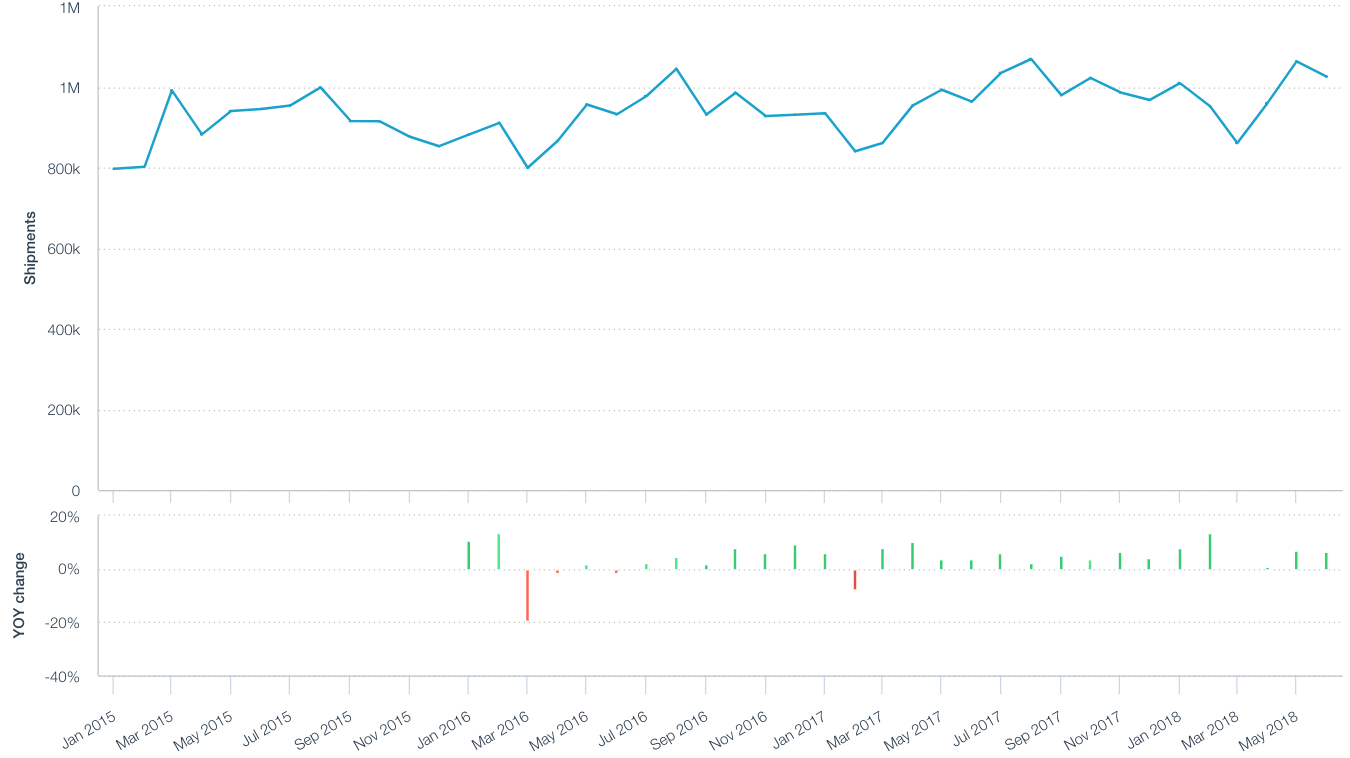
]]>The auto industry’s shipments rose 7% vs. a 2% decline a month earlier, likely due to concerns about an early completion to the section 232 “national security review”. Imports of steel and aluminum increased 6% indicating duties applied in the past two months trimmed rather than transformed supply chains so far.
The underlying demand for imports (based on consumer and business confidence measures) remains positive and the year-to-date performance suggests imports could rise 5% for the full year. Yet, with China accounting for 42% of imports the newly implemented tariffs will likely cut that growth rate in the coming months.
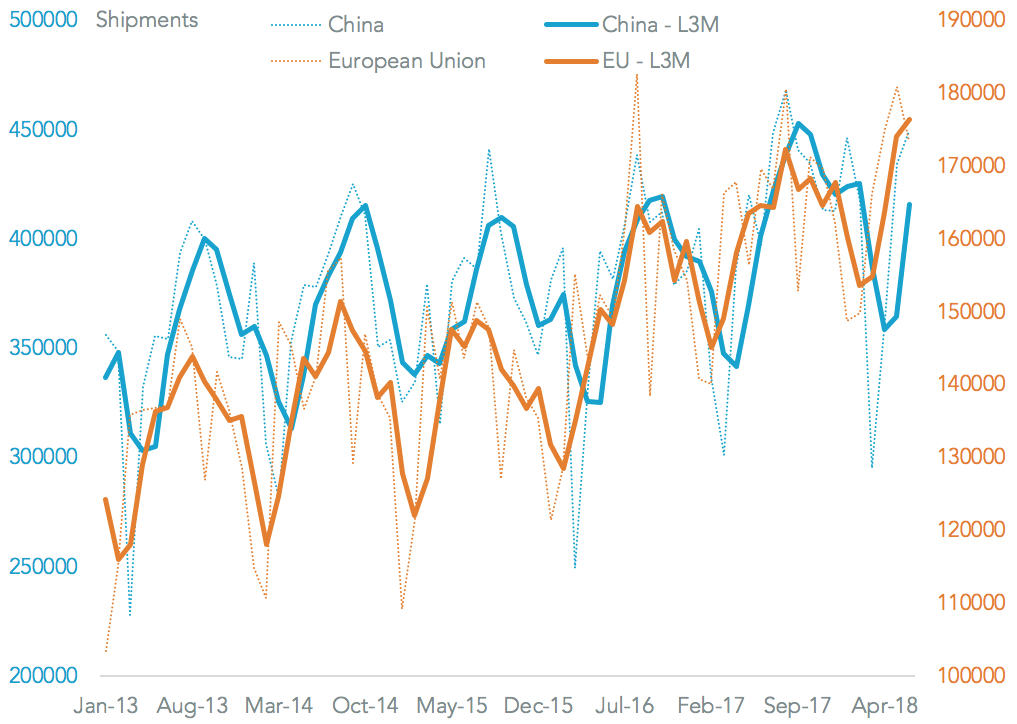
U.S. maritime imports climbed for a 16th straight month in June on a preliminary basis, Panjiva data shows, after a 6.5% increase vs. a year earlier. That left the second quarter as a whole 4.8% higher and would suggest the early stages of the wide-ranging duties applied by the administration of President Donald Trump haven’t cut imports significantly. Indeed, the threat of duties against Chinese imports from July 6, as outlined in Panjiva research of July 2, may have accelerated the rate of import growth.
Source: Panjiva
That can be seen in shipments from China that climbed 13.2% (from 3.4% in May and a decline in April) to a level normally associated with peak season deliveries. By contrast imports from the European Union, where there is a war of words rather than tariffs currently, only increased by 2.2% after a 15.6% rise in May.
Source: Panjiva
The increase in imports was broad-based with all the major industries tracked by Panjiva increasing vs. a year earlier for the first time since February (which was the result of the timing of the lunar new year).
The automotive sector saw a bounce with a 6.8% increase vs. a 1.5% decline the month earlier. That may reflect concerns that the section 232 review of the industry may be delivered before the midterm elections. The steel and aluminum sectors saw a 6.2% rise in shipments, confirming our earlier view that the section 232 duties applied over the past two months have trimmed rather than transformed supply chains.
Other major sectors increased by 6% to 7% (including machinery as well as consumer goods such as toys and apparel) while energy jumped 9.6%.

Source: Panjiva
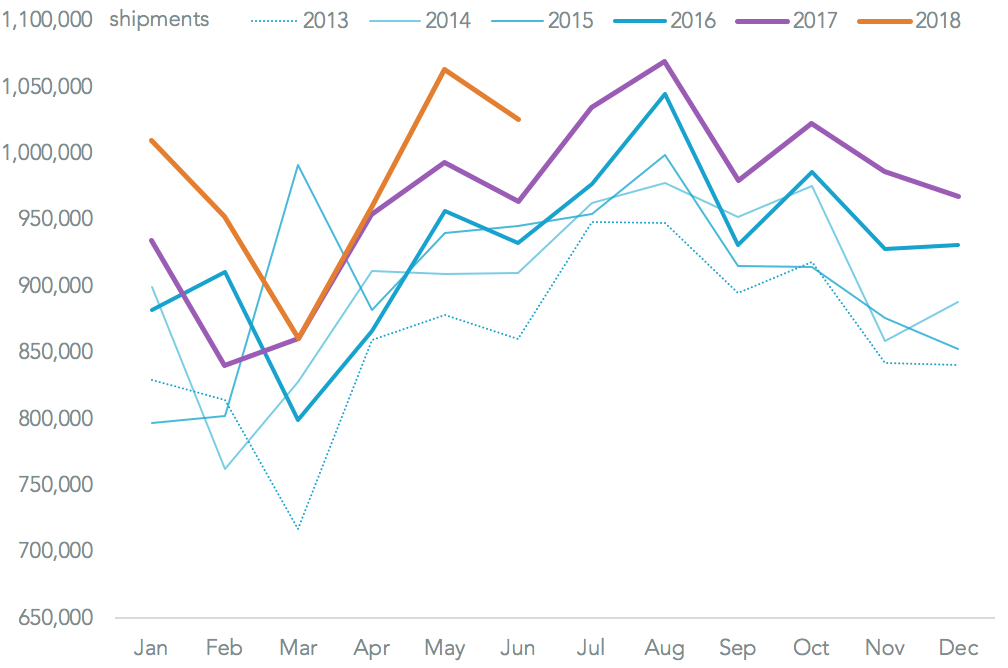
While there was a slowdown in growth in the second quarter to 4.8% from 7.1% in the first quarter, total shipments for the year are nonetheless on track for a 5.0% increase before the impact of tariffs. For context China represented 42.1% of shipments by count in the past 12 months. The fundamentals for underlying demand for imports are still strong though with business sentiment towards imports having improved in June. Consumer confidence took a small step back according to S&P Global Market Intelligence but still remains firmly positive.
Source: Panjiva
]]>
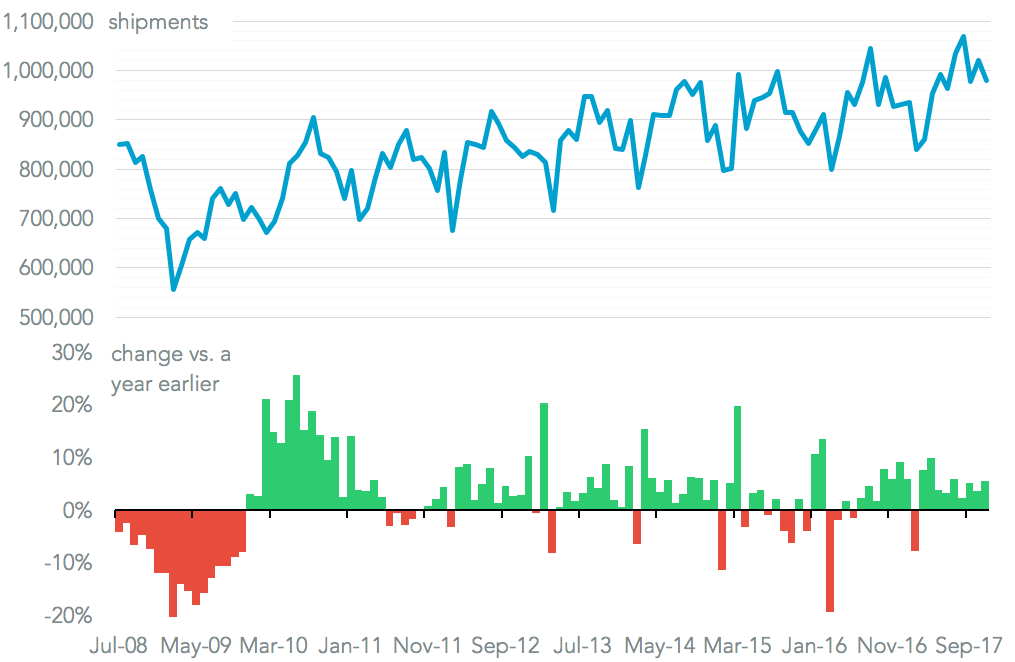
U.S. seaborne imports surged 13.0% higher vs. a year earlier in February, Panjiva data shows, making for the fastest rate of expansion since February 2016. That’s partly explained by the later-than-usual timing of the lunar new year, and is likely to result in a correction in March.
The optics of surging imports make a difference nonetheless, particularly with the Trump administration considering a broad range of tariffs on Chinese imports as part of the section 301 review of its IP policies, outlined in Panjiva research of March 8.
Source: Panjiva
That timing effect partly led to a 23.7% surge in imports from China, including Hong Kong, putting it well ahead of other markets except Vietnam (30.1%). Notably Taiwan saw a – possibly temporary – recovery back to growth with a 1.9% increase in shipments after nine straight months of decline. The only major country tracked by Panjiva that saw a decline was Singapore, which fell 12.7%.

Source: Panjiva
Products that have a high proportion of production in China also saw a more rapid growth including furnishings (24.7%) and toys (27.6%) as a potential pre-emption of tariffs. There is also likely a similar effect seen in imports of iron and steel which increased 19.0% (the fastest expansion since March 2015) and of the launch of section 232 tariffs. Even perennial underperformer apparel rose 12.3%. All the major product groups tracked by Panjiva experienced an increase, with the slowest being energy (including coal, oil and gas) which rose by a more modest 4.2%.

Source: Panjiva
The acceleration in imports on a quarterly trailing basis, at 8.1%, was the fastest rate since February 2013. That’s been supported by a mixture of robust consumer confidence (at its highest since November 2000 S&P Global Capital IQ data shows), business confidence (at an 11 year high according to the ISM survey), as well as potential attempts to “beat the tariff”. The latter may continue in March even as tariffs in metals begin assuming no short-term announcement of section 301 tariffs (or concerns about backdating).
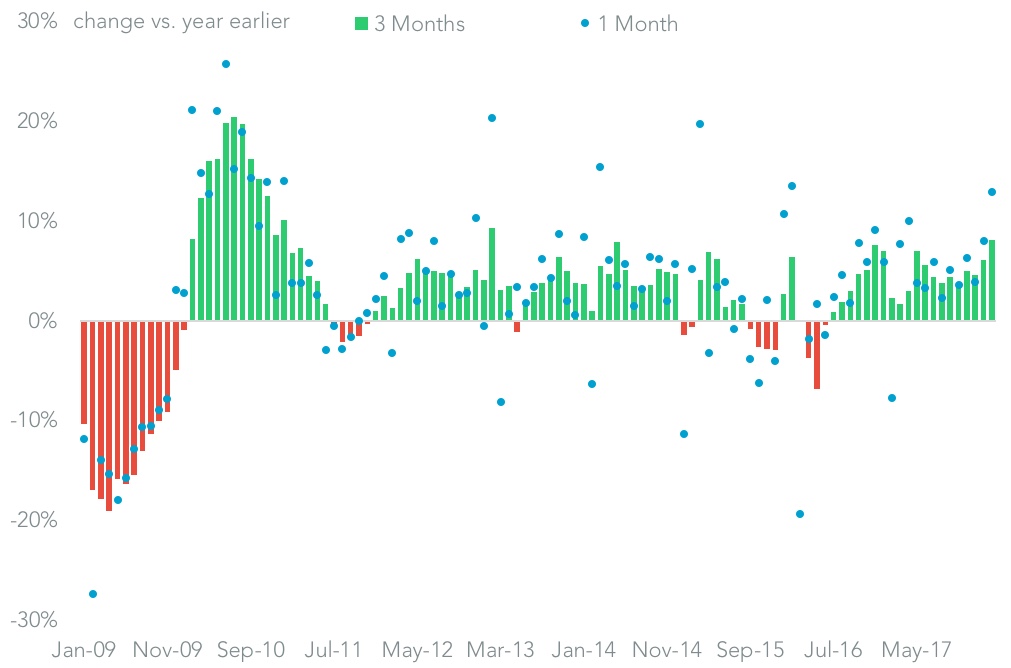
Chart compares growth in U.S. seaborne imports on a quarter (bar) and monthly (dot) basis. Source: Panjiva
]]>
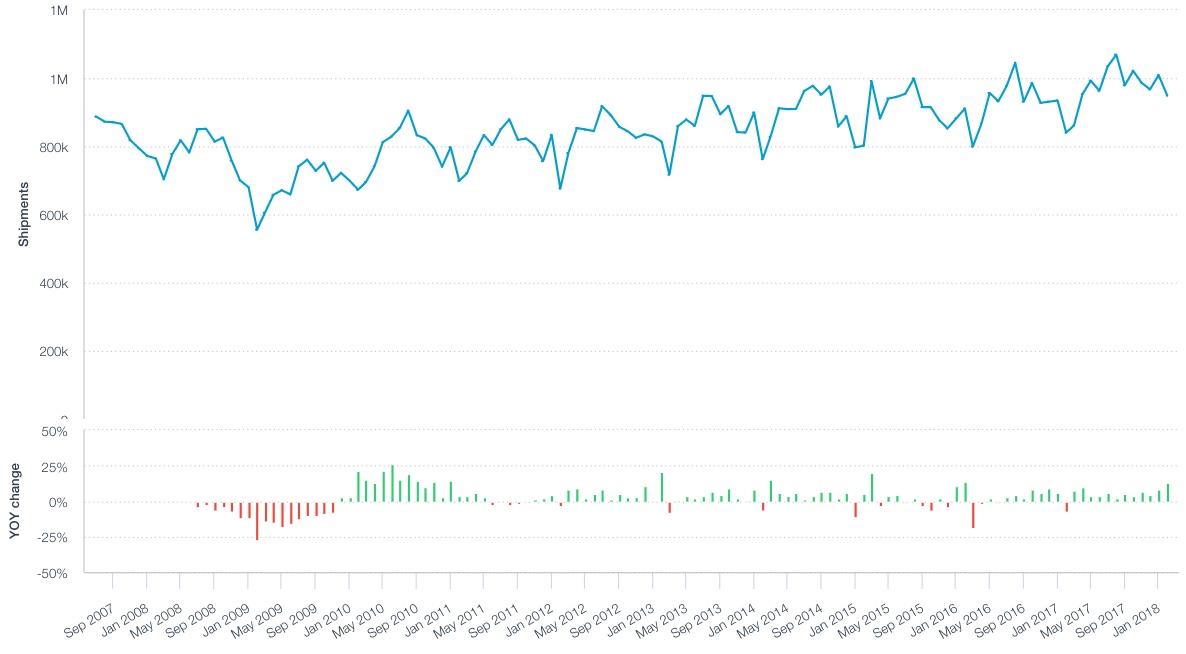
U.S. imports opened 2018 with a bang, Panjiva data shows, with seaborne shipments in January having risen 7.7% on a year earlier. That was the fastest rate of growth since April, and well ahead of the 4.1% recorded for 2017 as a whole. It also comes after a record year for U.S. imports in aggregate, as outlined in Panjiva research of February 26, which in turn led to a record trade deficit.

Source: Panjiva
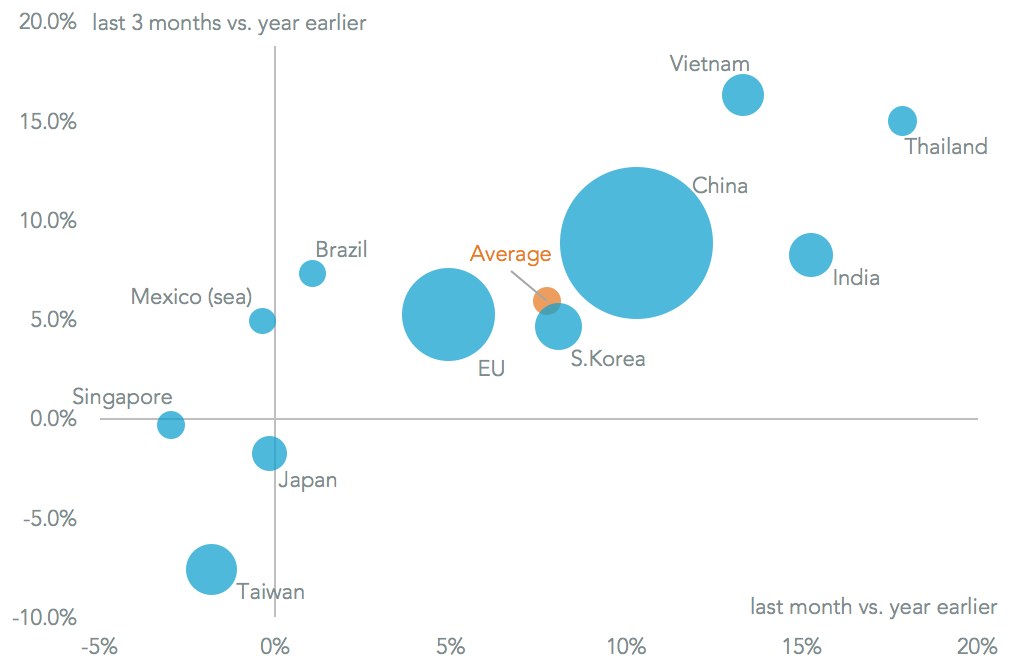
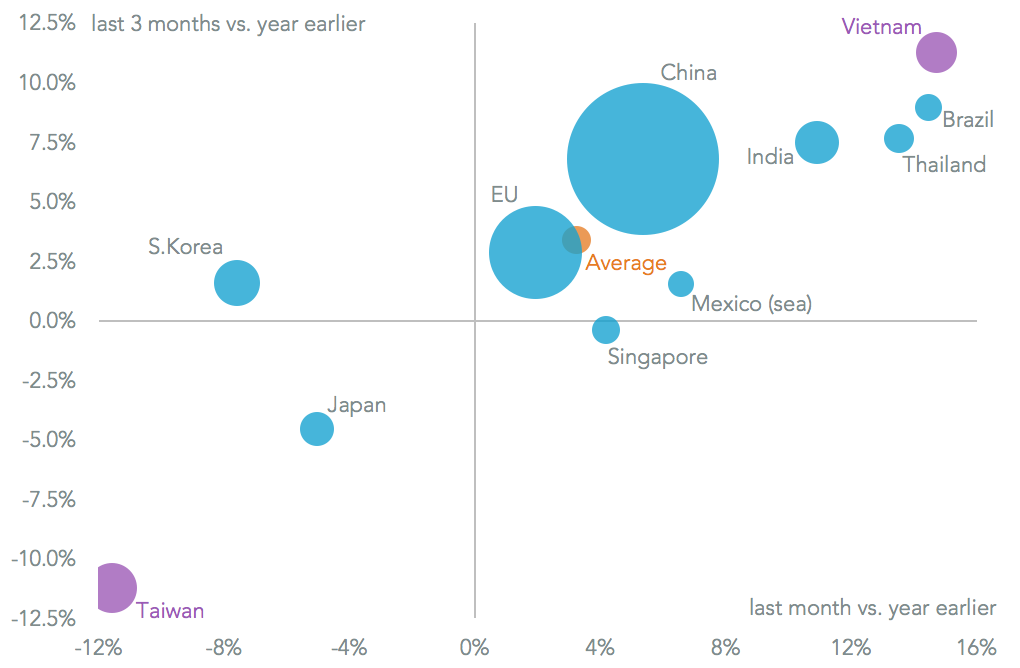
Among the main supplier economies a 10.3% jump in shipment from China was the main driver, and continues a run of growth going back to February. That growth may continue in the coming month as the lunar new year holiday is later this year, and so will only cut shipments leaving from mid February rather than late January.
Exports from developing economies with expanding manufacturing sectors continued, with shipments from India having increased by 15.2% while those from Vietnam improved by 13.3%. The more mature markets of Taiwan (down 1.2%) and Japan (off by 0.2%) lost out, though the European Union continued to grow its shipments to the U.S. with a 4.9% improvement.
Source: Panjiva
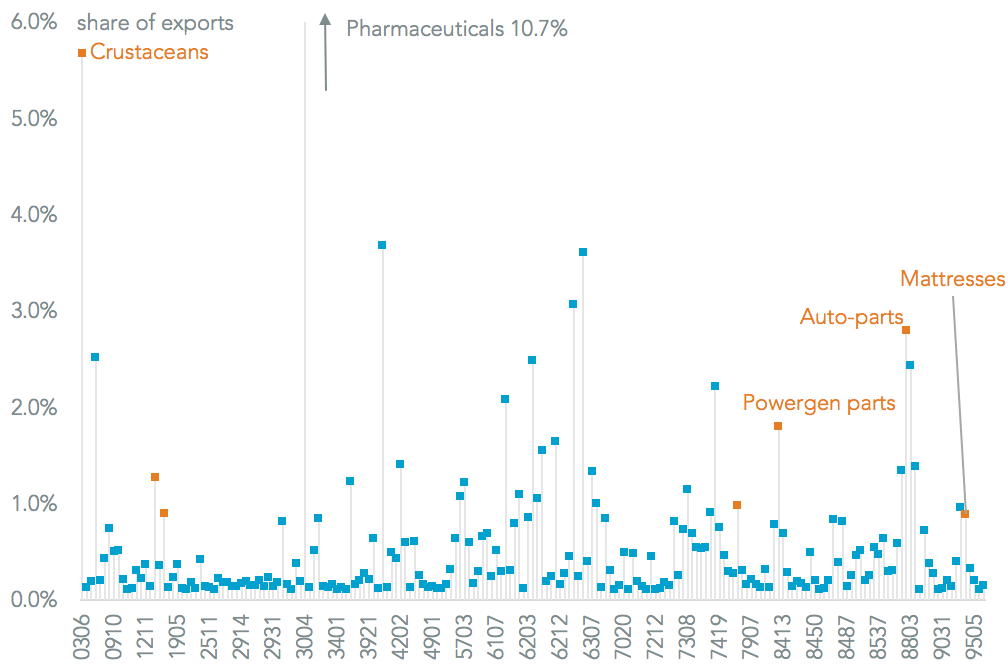
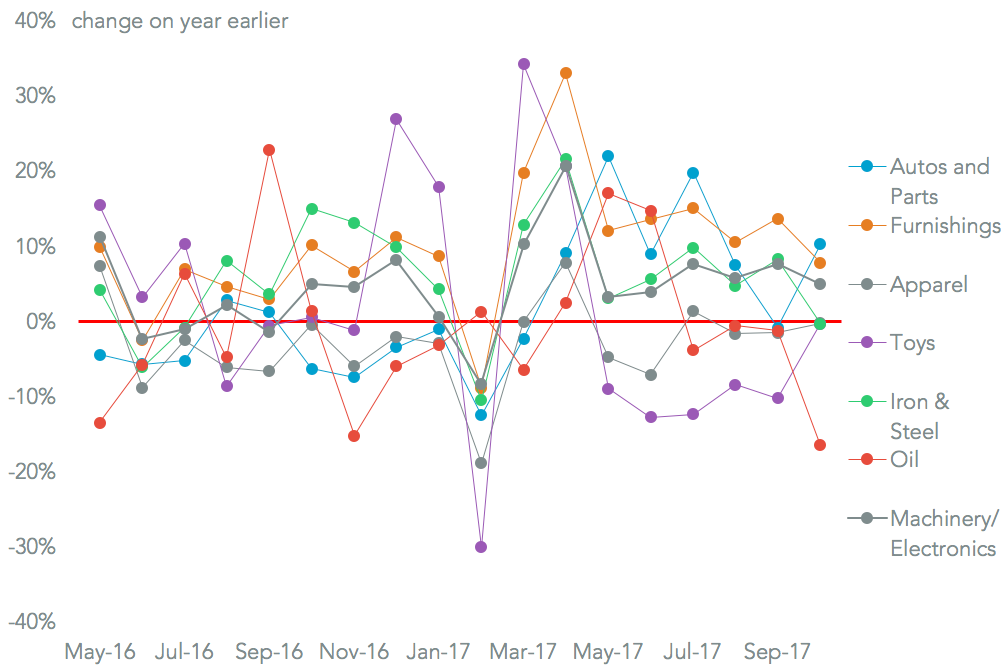
All the major product groups tracked by Panjiva saw growth for the first time since February 2016. Autos were the slowest at 2.7% while toys (13.0% higher, beating the seasonal lull) and machinery / electronics (up 12.2%) being the fastest. That likely reflects three major factors which may remain supportive for imports for the next couple of months at least.
American business confidence remains high after the tax reform, leading suppliers to expect an increase in investment. Consumer confidence has begun to slip from 10 year highs according to Bloomberg, though spending growth has continued.
Third, while the Trump administration has begun to implement tariffs on imports these have yet to be widespread, with only washing machines and solar panels seeing significant moves so far beyond normal anti-dumping cases.

Source: Panjiva
]]>
#1 Trump’s GSP renewal could leave India out (Jan 4) The Generalized System of Preferences allows duty free imports of 5,000 products to the U.S., with India the largest beneficiary. It has now lapsed, and while the Trump administration is expected to renew it, there may be adjustments. India has $23 billion trade surplus with the U.S., though only 14% points of the top 65% of its exports are eligible. One alternative is to target specific products for exclusion including auto-parts or aluminum.
Source: Panjiva
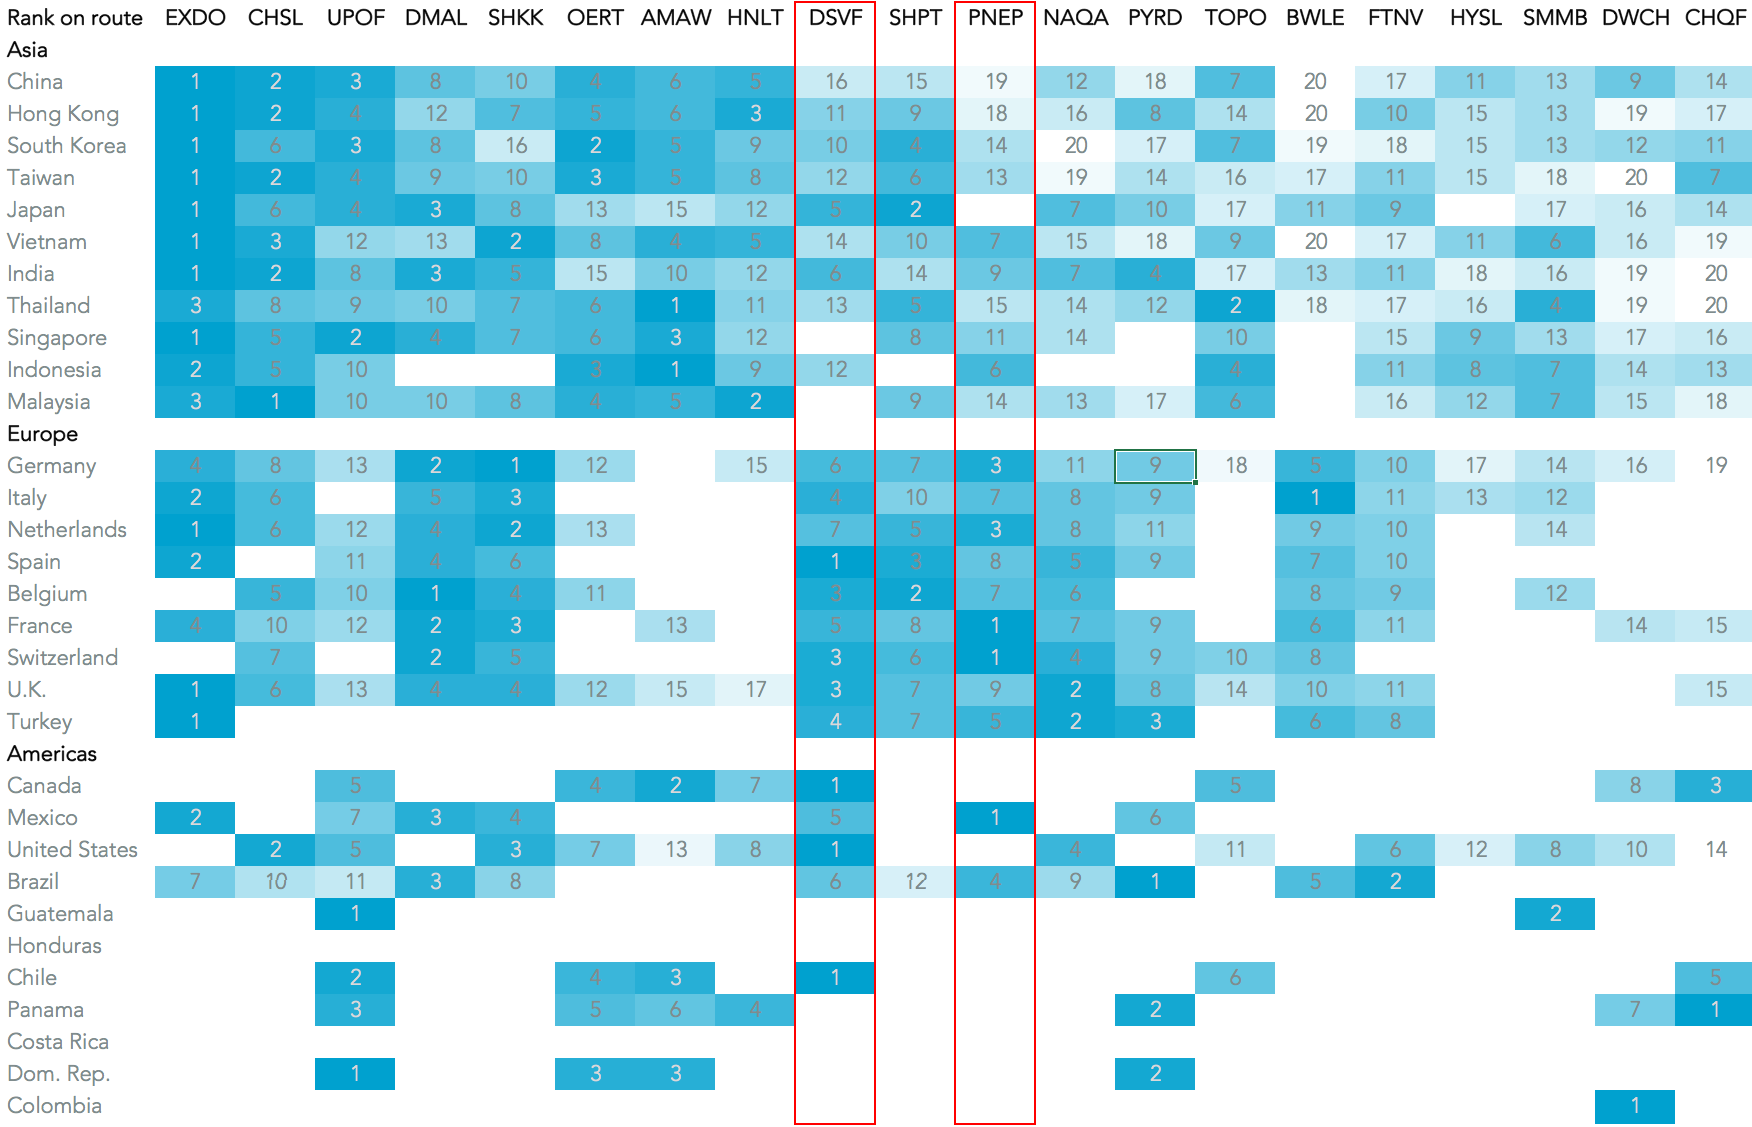
#2 K+N looks east for deals, but has competition (Jan 8) K+N’s Chairman, Joerg Wolle, has indicated the company is looking for bolt-on deals in Asia. That would put it in competition for assets with Panalpina and DSV, though a wide range of consolidation in the fragmented forwarding industry is needed. Potential targets on Asia-U.S. routes would include Kerry Logistics, Orient Express or Honour Lane among larger firms, while mid-sized operators include Hecny or De Well.
Source: Panjiva
#3 Action on metals possible after Trump-Xi call (Jan 17) A phone call between President Xi and President Trump included a discussion of how to address the trade imbalance between the two countries. Xi called for a continued economic dialogue, while Trump referred to the deficit as being “not sustainable”. That heightens the likelihood of increased U.S. tariffs in the context of the section 301 review of Chinese IP practices. Should the President wish to avoid hitting consumer goods, the largest Chinese export lines to the U.S. where tariffs could be applied include base metals ($12 billion) and plastics ($13 billion).

Source: Panjiva
#4 201 down, 6 to go (Jan 22) President Trump’s willingness to take action on consumer goods was proven a few days later when he applied tariffs of up to 50% on washing machine imports and 30% on solar panels under the section 201 “safeguarding reviews” of each product. Manufacturers of both had raced to build inventories, with washing machine imports in the fourth quarter being 194% higher than in the first, and solar power equipment 199% higher.
Source: Panjiva
#5 26 actions taken, deficit still rising (Jan 18) One year on from the inauguration we identified 26 specific actions on trade policy taken by the Trump administration ranging from renegotiations of trade deals, new trade cases of varying stripes (see above) as well as several items left on the to-do list. Yet, while the President has kept his promise to act, the trade deficit has continued to grow and breached $50 billion for the first time in November since January 2012.

Source: Panjiva
#6 Black swan risks for 2018 (Jan 5) Out of the eight reports we published in our 2018 Outlook series it was the attempt to spot low-probability / high-materiality risks for global supply chains that got the most attention. Conflicts in the South China Sea or Middle East worry us most, while a simultaneous NAFTA failure / border wall combination could have more mundane but still expensive consequences. Port labor disputes in response to automation plans could strike later in the year, while mega-mergers in the container-line space are still a possibility if profits don’t recover.
Source: Panjiva
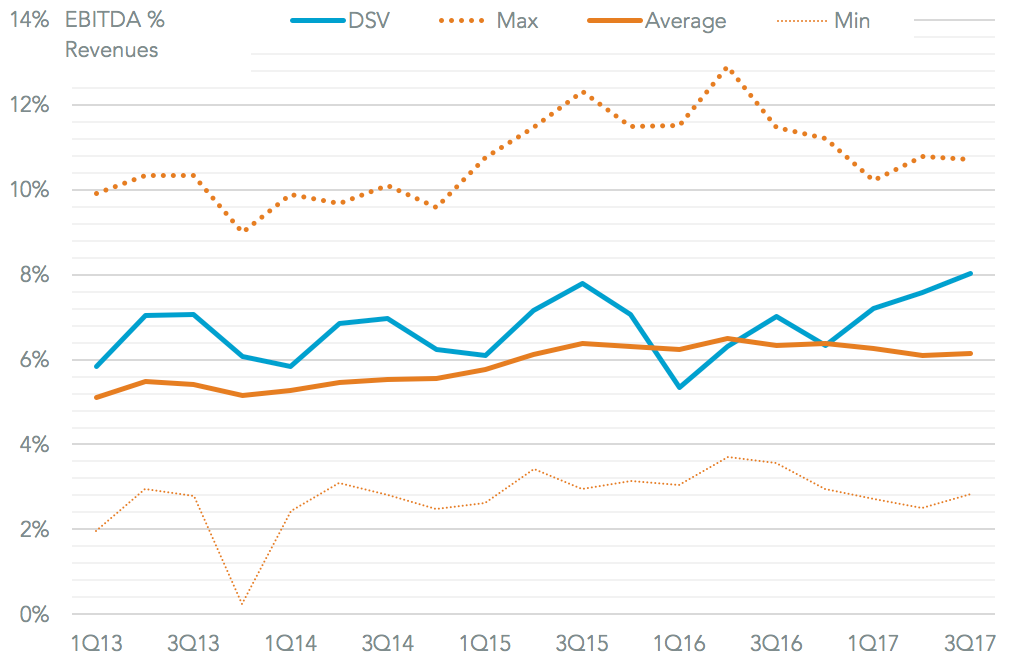
#7 CH Robinson bests Nippon Express (Jan 31) The freight forwarders’ 4Q earnings may be better than anticipated, with both CH Robinson and Nippon Express reporting higher revenues than expected (CH Robinson did slightly better) and profit margins inline with analysts’ forecasts. Yet, both are below the industry average 11% EBITDA margin. The main risk remains a price war that could be triggered by the U.S. tax reform’s impact on corporate tax rates.
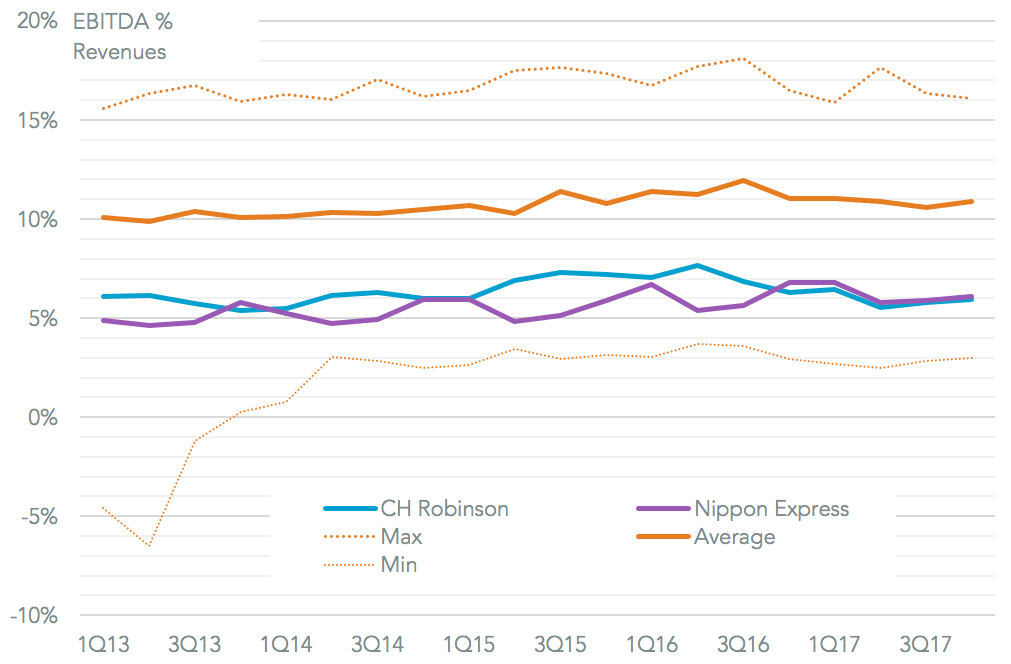
Source: Panjiva
#8 Record 2017 volumes for forwarders (Jan 11) Freight forwarders had a record 2017 in terms of U.S.-inbound seaborne freight with a 4% rise in December. Orient Express was the most aggressive in expanding in December (16% higher) while Expeditors took a step back (down 1%). That took Orient Express up three places to third in the volume rankings. Our full year trade-lane analysis showed only Expeditors and K+N have more than a handful of top three ranks, indicating the degree of fragmentation and need for consolidation in the industry.
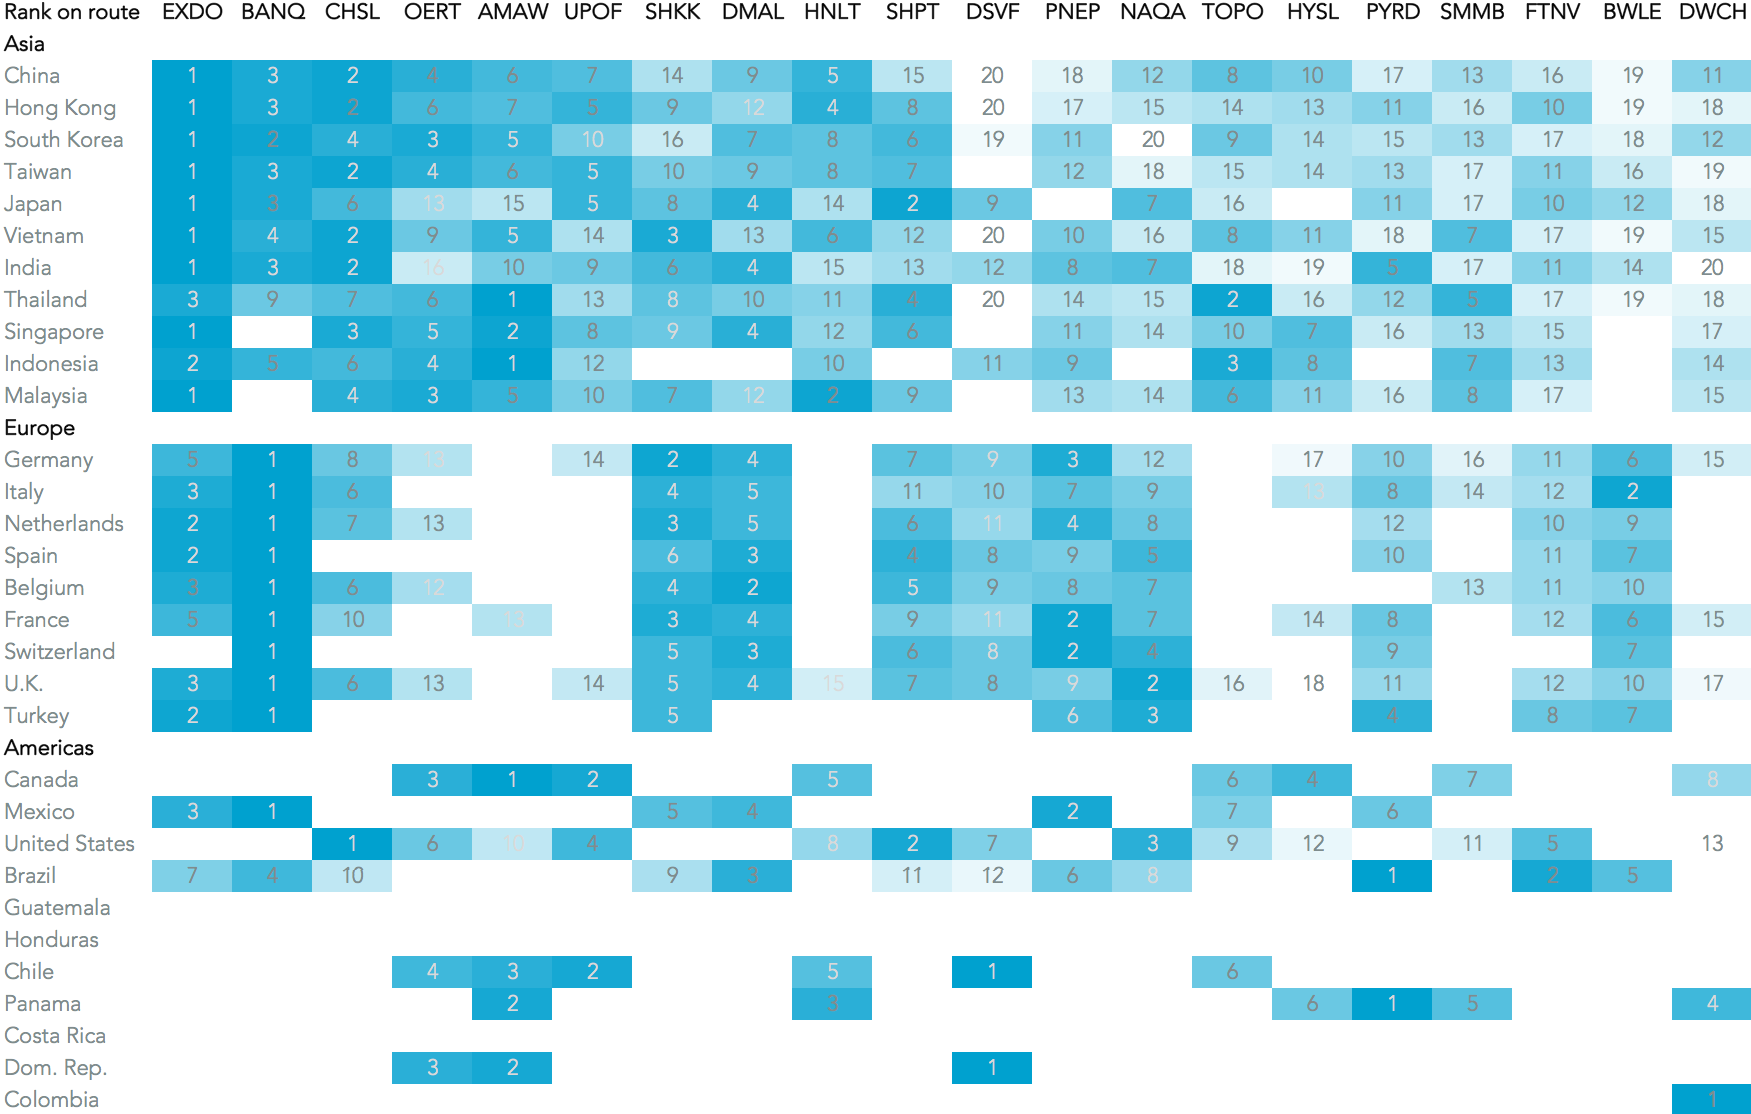
Source: Panjiva
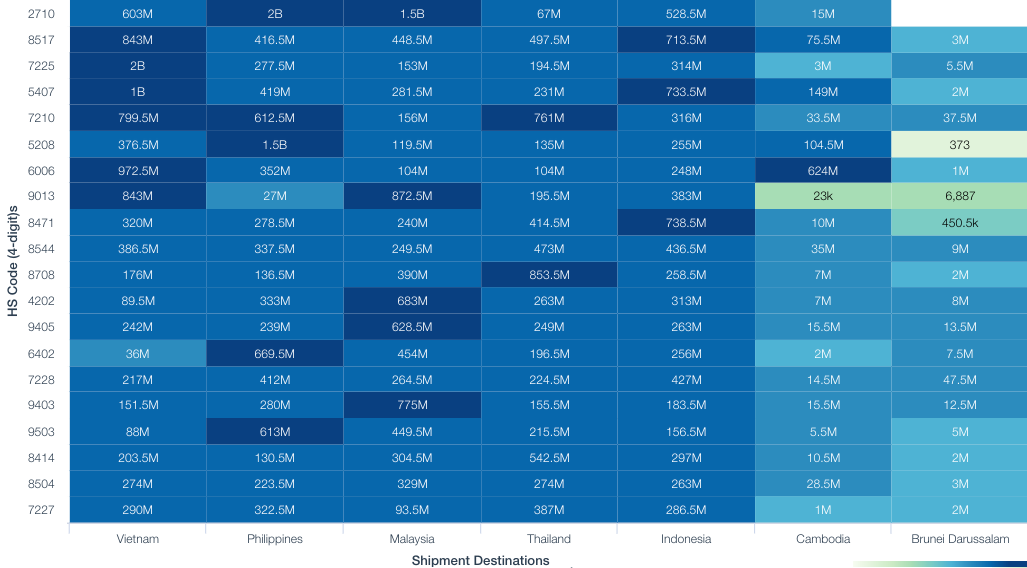
#9 Make-in-India comes to the fore (Jan 25) The Indian government announced, or was reported to be ready to implement, several protectionist measures to support the “Make in India” strategy in January. We covered the phenomenon in a series of reports, including an analysis of how it could spoil an attempt to build relations in the ASEAN region. At particular risk are relations with Singapore, Thailand and Vietnam on the basis of their consumer electronics exports to India.

Source: Panjiva
#10 NAFTA to die another day (Jan 30) The sixth round of NAFTA talks was to have proven pivotal, and needed an agreement on automotive rules-of-origin to avoid a U.S. withdrawal. Yet, the three parties appeared to consider negotiations beyond the previous March deadline, leaving the process free to continue for now. The U.S. rejected Canada’s suggestions on altering the weightings used in ROO calculations, casting doubt over the supply chains of General Motors and Fiat-Chrysler in particular.
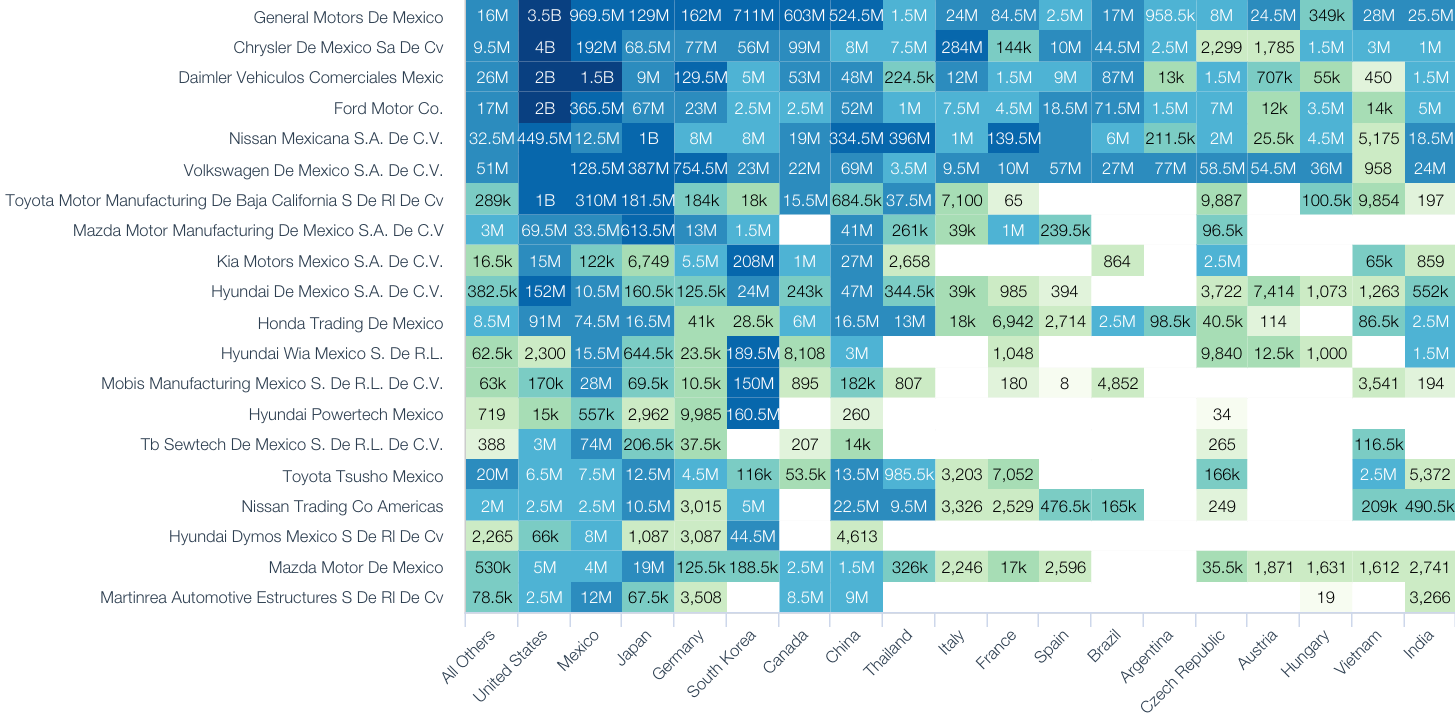
Source: Panjiva
]]>
U.S. imports ended the year on a high note with a 3.8% increase in seaborne shipments in December, Panjiva data shows. That was the 17th increase in the past 18 months, and brought the total for 2017 to a 4.1% rise to reach 11.6 million shipments.
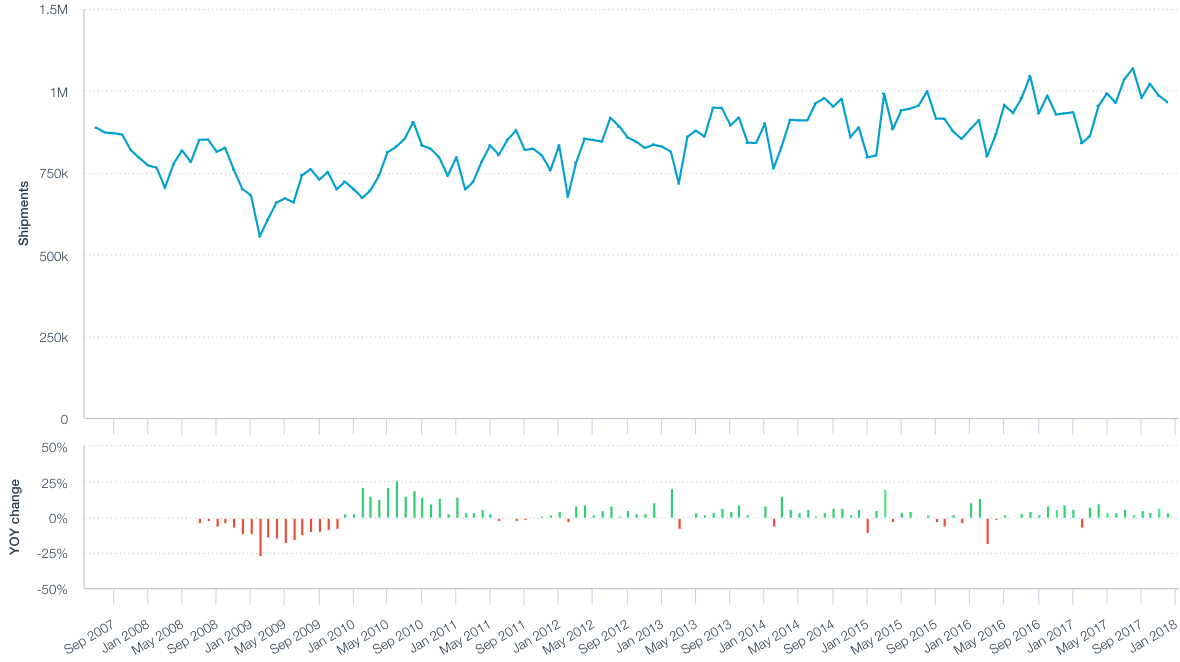
Source: Panjiva
The performance of trade during the latter part of the year shows some evidence for the “ship later” strategies being followed by retailers and other importers as they seek to optimize inventories. In 2017 16.8% of full year shipments arrived in November and December, compared to 16.7% in 2016 and 16.3% in the prior five years. For early 2018 it is worth noting that lunar new year starts 19 days later than in 2017, potentially flattering January and February figures.
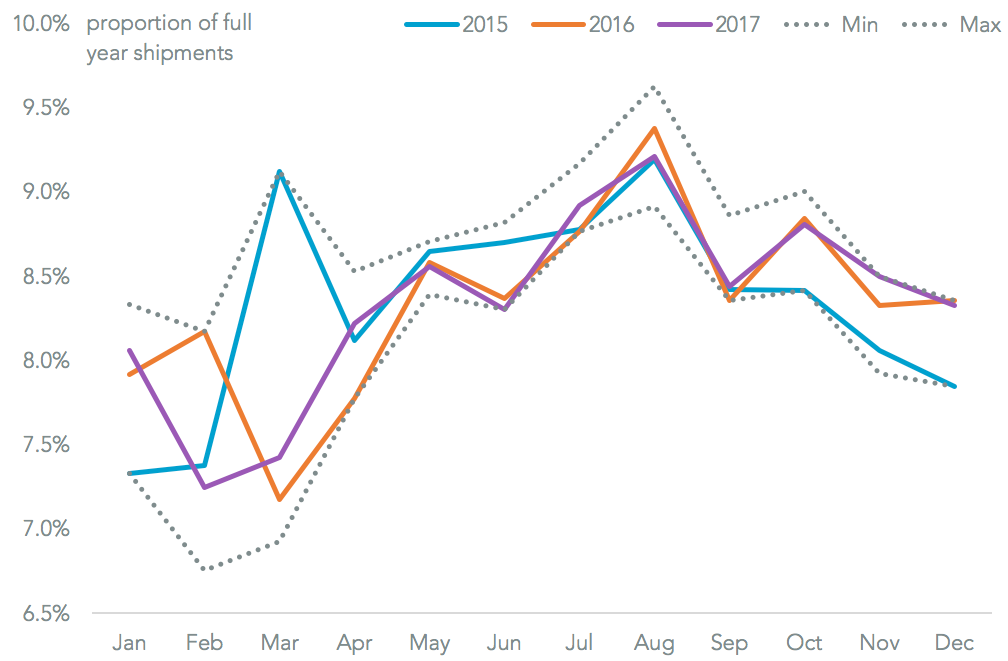
Source: Panjiva
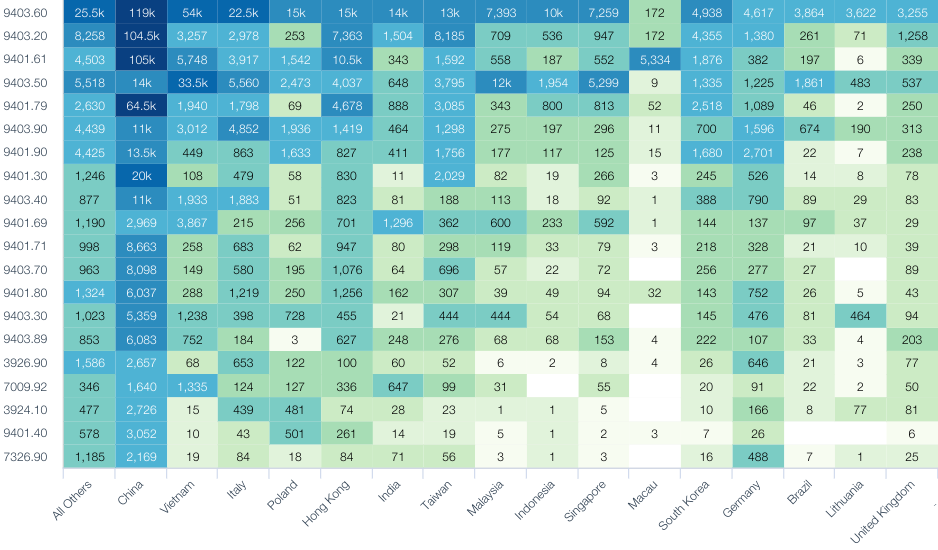
As has been the case for most of 2017 the fastest growing major exporter to the U.S. has been Vietnam, with a 17.3% increase in December and 12.6% for the year as a whole. That’s been driven by a relocation of manufacturing capacity from mature Asian markets including Japan (down 3.2% for the year) and Taiwan (6.8% lower). Vietnam has now consistently outpaced Japan as an exporter to the U.S. since April 2017.
Yet, China remains the dominant reason for U.S. import growth though with a 7.1% rise for the year. That may soon come to a halt though, as outlined in Panjiva research of January 8, if the Trump administration makes good on its threat to apply broad-based tariffs in retaliation for intellectual property rights rules violations.

Source: Panjiva
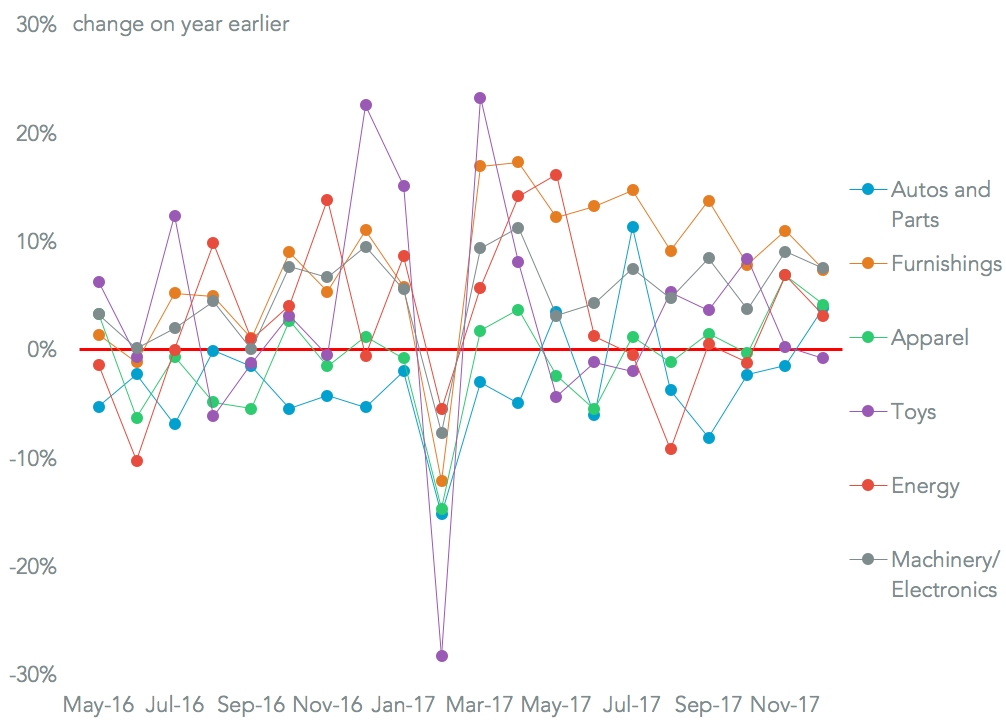
At the product level the strength in consumer and business sentiment in the U.S. continued to make itself felt. Among consumer durables imports of furniture climbed 7.4% in December to end the year 8.7% higher. With 51.9% of imports of furniture having come from China in 2017 that may be an area for tariffs to be applied if the Trump administration are willing to make consumers bear the price of not buying American.
Source: Panjiva
The worst performing major sector for the year autos which saw a 2.3% decline in shipments for the year overall as light vehicle sales dropped. Second worst was apparel with a 0.7% decline for 2017, though a 4.1% growth in December suggests a turnaround may be underway. At the business level imports of machinery and electronics climbed 7.5% to end the year 6.8% higher. With business sentiment regarding trade in the U.S. at the highest since 2014, and at multi-year highs globally, it would be a surprise to see an end to import growth in the near term without significant protectionist policy intervention from the government.
Source: Panjiva
]]>The growth in U.S. imports seen throughout 2017, with the exception of February, accelerated in November. Seaborne shipments climbed 5.6% on a year earlier, Panjiva data shows, reaching 10.625 million for the month.
Source: Panjiva
The longer term trend of a rotation of manufacturing capacity, and related exports to the U.S., from the more-developed to less-developed Asian economies. Shipments from Vietnam soared 18.7% higher and those from Thailand climbed by 15.0% while those from Taiwan fell by 8.8% (the seventh straight drop) and from South Korea there was a 1.1% decline.
China remained the number one supplier after an 8.3% rise – it’s 2.6x the imports from the EU – and number one generator of the expanding U.S. trade deficit, as outlined in Panjiva research of December 5.

Source: Panjiva
At the product level the most marked turnaround was the apparel sector. Imports expanded by 6.9%, the fastest rate of expansion since February 2016. That may indicate that the steady process of moving to leaner inventories may have reached a conclusion.
By contrast shipments of toys fell by 0.4% vs. the prior year after three months of growth, potentially as a result of the bankruptcy filing by Toys’R’Us as well as a rotation to electronics as gifts. Automotive imports also did poorly, with a 3.2% reduction tracking the downturn in sales of imported vehicles.
Among industrial products imports of iron and steel surged 7.7% after a small reduction the prior month. Continued delays in implementing the section 232 reviews of the industry by the Commerce Department have left the window open for suppliers to continue building inventory. Continued business confidence – and consumers’ appetite for electronics and appliances – drove the imports of electrical and electronics equipment 8.5% higher. That was the 18th increase in the past 19 months for the sector.

Source: Panjiva
Going into the last month of the year the conditions for growth look robust. Business surveys remain firmly in positive territory globally, albeit with a modest reduction in optimism in the U.S. more recently. Consumer confidence meanwhile has continued to rise, and reached its highest since November 2000, Bloomberg data shows.
Finally, it looks unlikely that the administration of President Donald Trump will enact broad-based protectionist measures before year end, and even if it does (for example the section 301 review of China) the impact won’t be felt until 2018. As a consequence, and on the basis of prior year’s patterns, U.S. import growth in 2017 overall could reach 3.8% (upgrade from 3.4% last month) or 11.56 million shipments.

Source: Panjiva
]]>
The single most-read article was the write-up of our China Trade Opportunities webinar, where attendees wanted to know more about the state of the solar power industry and responses to U.S. cases. Our deep-dive into the Chinese government’s decision to cut 187 consumer-products tariffs also got attention – we noted it may not have been necessary given the surge in imports so far. In logistics the activities of the freight forwarders, including Expeditors’ sector-leading results, garnered the most interest. Finally back in the U.S. the disappointing fifth round of NAFTA talks, the trade review of washing machines and Black Friday bargains all made it into the top 10.
#1 The $4 Trillion China Trade Opportunity (Nov 15) We held a webinar on November 15 to discuss the opportunities in China’s $4 trillion trade economy including the policy environment, the preoccupations of our China-based customers (one word: Trump) and six major sectors. Questions asked included: the state of Chinese solar power exports to the U.S. (not good); buyer responses to U.S. trade cases against Chinese exports (buy somewhere else, raise prices); and the impact of Chinese government regulations (state-owned enterprise reform matters more than the environment). A recording of the webinar is available via the link.
Source: Panjiva
#2 President Trump Goes To Asia (Nov 1) The major trade policy event in the month was President Trump’s Asian roadshow, which was widely expected to focus on national security and trade – often the two were intertwined. Our preview got many things right (no major policy launches, a focus on commercial deal announcements) but a couple wrong (see #8 below). As outlined in our follow-up report of 11/14 it was clear the administration were happy that their “deficit must fall” message had been delivered.
#3 UPS beats Expeditors, at a cost (Nov 9) U.S. import performance data for the freight forwarders in November provided the first data read after their third quarter earnings reports. UPS led the way with a 27% rise in volumes vs. a year earlier. Meanwhile Expeditors only gained 2%, but that followed it maintaining best-in-class profitability after shedding market share in the third quarter (see item #6 below).
#4 187 ways to grow $35 billion of exports (Nov 27) The Chinese government’s decision to cut imports tariffs on 187 products was clearly aimed at boosting consumer spending. They may prove unnecessary. Our analysis showed Chinese imports of the products involved reached $34.7 billion in the past 12 months, having risen 33.9% in the third quarter on a year earlier. That took them to the highest since at least 2013. Food and cosmetics were the leading categories.
Source: Panjiva
#5 Trump trade strategy in a $90 tariff (Nov 21) The conclusions of the second section 201 “safeguarding” review, which is focussed on large residential washing machines, emerged during the month. The ITC proposed to President Trump that 50% tariffs be applied to imports over 1.2 million units a year. We calculated that’s equivalent to $90 per machine, or 11% of average list prices. The President has yet to act though – near month end the USTR requested further consultations with the public, as outlined in our 11/29 analysis.
#6 Expeditors leads the forwarders forward (Nov 8) Expeditors International reported third quarter revenues that were 5% better than expected, with the ocean freight business turning in its first unit revenue growth since 1Q 2016. Even allowing for that apparent discipline the company was still the fastest growing of the six forwarders Panjiva covers. It also hed the best profitability, with an EBITDA margin of 11% putting it at the top of the table, where it’s been since at least 2013.
#7 41 changes, NAFTA basics stay the same (Nov 20) The NAFTA negotiations had another torturous month. Ahead of round five the USTR published changes in its negotiating stance – our assessment found 41 significant changes. Most related to trade-in-goods and include: dealing with import/export monopolies; regulatory convergence in six sectors; specific references to Canada dairy/poultry tariffs and improved U.S. market access for beverages; rules-of-origin with U.S.-specific elements, that notably are not just limited to autos; and improved market access for U.S. healthcare products. Sadly the round ended without much success, with the next “full” round put back to January (December will see technical discussions only).

Source: Panjiva
#8 Trump does a Duterte deal (Nov 17) We hadn’t expected any new bilateral trade processes to start during President Trump’s trip. We were wrong. One little-noticed element of President Trump’s recent Asia visit was an apparent agreement with President Duterte to structure a free trade agreement between the U.S. and the Philippines. Greater access to the U.S. market makes sense for the Philippines, with trade focussed on just three areas (semiconductors, apparel and agriculture). The U.S. meanwhile may want increased access to the Philippines’ fast growing healthcare sector.
#9 $253 billion, but no reset in China (Nov 9) The headline figure for the President’s trip to Asia though was the $253 billion in commercial agreements signed. We took a deep dive into the figures involved, and while it’s easy to be skeptical the deals with Boeing, Qualcomm and in the agricultural sector could all make a difference to the U.S. trade deficit longer-term. Upon returning from the trip though the section 301 review of Chinese IP practices continued, and a “self-initiated” aluminum trade case against China was launched (see our 11/29 report for more).
#10 Black Friday bargains (Nov 20) Aggressive discounting can frequently follow aggressive importing around Black Friday / Cyber Monday (or indeed the broader shopping fortnight that accompanies the two). Our review of major import lines showed shipments of washing machines spiked (see #5 above) and laptop computers (particularly by HP Inc) were markedly ahead of a year earlier, and so might have opportunities for bargain hunters.
Source: Panjiva
]]>
U.S. import growth continued unabated in October, with Panjiva data showing seaborne import shipments rose 3.2% on a year earlier. That makes the eighth straight month of growth, and 15th out of the past 16 (February’s drop reflected the timing of lunar new year). Year-to-date shipments of 9.63 million are a record for the first 10 months of the year. That shows earlier worries of a protectionist crimp on trade from the policies of the Trump administration have not yet taken effect.

Source: Panjiva
Geographically, growth in absolute terms was once again led by shipments from China and Hong Kong, which increased by 5.4%. While the slowest rate of expansion since June, it would suggest yet another rise in the U.S. trade deficit with China lies ahead as outlined in Panjiva research of November 5.
The long-term trend of rotation in manufacturing industries out of Taiwan, South Korea and Japan and into lower cost economies including India, Thailand and Vietnam was also in evidence. Shipments from Vietnam climbed 11.2% to equal July’s record, while imports from Taiwan dropped 11.6% to their lowest in a decade.
Source: Panjiva
At the product level department stores are reported to be taking deliveries later than in prior years due to concerns about demand, Reuters reports. Imports of apparel lagged, though tjey were only 0.4% lower than a year earlier, while toys fell by 0.4%. The latter is notable though as there had been five straight declines of 9% or more in the prior months, possibly due to concerns about the future of Toys’R’Us. Other consumer goods remained robust, however, with furniture imports rising 9% and autos/parts rising 10%. The latter is a response to replacement demand after September’s hurricanes, though may prove fleeting.
Source: Panjiva
The strong performance of imports year-to-date would suggest – on the basis of prior years’ trade – that aggregate shipments should reach 11.51 million in the full year, or 3.3% better than a year earlier. Continued strength – albeit fading somewhat – in both business order expectations and consumer confidence (at near 17 year highs) would suggest imports will continue to grow in the remainder of the year. That’s assuming, of course, that no significant protectionist measures are implemented at late notice.

Source: Panjiva
]]>#1 UPS heads up, Expeditors loses share and deals are debated (Oct 10) U.S.-inbound volumes handled by NVOCCs climbed 5% on a year earlier, led by Asian traffic. Expeditors lagged with growth of just 3%, while UPS surged ahead by 32%. That placed it third, just ahead of Deutsche-Post DHL. Both DSV and Panalpina are considering acquisitions (more on that later) – our analysis of 2,400 country-carrier pairs shows a tie up with Honour Lane, Kerry or Orient Express could help build stronger global platforms.
Source: Panjiva
#2 13% Import-Export spread predicts wider deficit (Oct 25) Container handling at the top eight ports in the U.S. tracked by Panjiva indicate import growth of 8.8% in September outpaced a 4.5% drop in exports. Only Puget Sound was an outlier in that regard. The gap would suggest there is room for an 11th straight increase in the trade deficit, subject to price moves (which also support a wider deficit) and other transportation modes (which have yet to be reported). Incidentally, government data the following day confirmed the deficit widening.
#3 Panalpina’s deal hunger, ready for “major takeovers” (Oct 4) Panalpina’s Chairman, Peter Ulber, stated the firm is ready for “major takeovers”. That followed a series of weak earnings reports (later in the month it reported an 11th straight miss) and a loss of market share on U.S. inbound traffic. Our analysis indicates a tie-up with an Asian partner on China inbound routes would be a good fit, though most of the local forwarders already have major shareholders who may not be willing sellers.
#4 DSV beat K+N and Panalpina, confidence for acquisitions remains (Oct 26) DSV appears to have been the best performing of the forwarders in the third quarter (among those reporting so far) with an increase in its profitability to 8% from 7% a year earlier on an EBITDA basis. Management also reiterated their confidence in its ability to make acquisitions in the 1 billion euros ($1.3 billion) territory, though debt financing should not be taken for granted.
Source: Panjiva
#5 NAFTA delay a good idea, for the wrong reason (Oct 18) The fourth round of NAFTA talks went badly. The extension of negotiations into 2018 reflects a realism about the gulf in positions between the three parties. The U.S. remains fixated on cutting the deficit, while Canada and Mexico are unwilling to accept rules-of-origin and dispute settlement proposals. Ultimately though none can afford to leave – Mexico and Canada ship 75% and 80% of their exports to the U.S., and the U.S. sends 42% of its exports in return.
#6 Wrapping up a year of radical change (October 3) Our preview of global trade issues to watch in the fourth quarter include: NAFTA negotiations; America’s review of China’s intellectual property rights; KORUS negotiations; U.S. trade cases in steel, aluminum, jets, lumber, washing machines and solar panels; RCEP, TPP, EPA and others all need locking down; falling, and now rising, container rates; freight forwarder and carrier consolidation; and supply chain resilience. Phew!
#7 Tesla tests the mold in Shanghai (Oct 23) Automaker Tesla is seeking to build a factory in China without a local partner. Such a factory in Shanghai’s FTZ would be a first, but would still attract 25% tariffs when vehicles leave the FTZ. China is one of Tesla’s fastest growing markets, with 22% growth sequentially in 3Q vs. 2Q and $432 million of imports.

Source: Panjiva
#8 Another spin of the washer strategy for Samsung (Oct 6) The U.S. ITC determined that U.S. industry has been harmed by washing machine imports, and will assess policy proposals for President Trump through early December. The President will then be able to decide whether to apply tariffs or quotas. U.S. imports climbed 53% in the third quarter on a year earlier as shippers including Samsung Electronics and LG Electronics rush to get in the door. Both are already moving production to the U.S. though.
#9 “Terminate” no more, maybe (Oct 25) President Trump has stated that if NAFTA talks “don’t turn out, we’ll have to do a new NAFTA”. That’s a marked difference from prior threats to “terminate” the deal if acceptable terms cannot be reached. It is important not to read too much into this as the President’s tone regarding the talks has shifted before. One issue to consider is the seasonality of the trade deficit with Mexico, which has been the President’s central problem with NAFTA and could peak at over $7 billion in October.
#10 Xi takes the five year view, and beyond (Oct 13) China’s five yearly National Congress of the Communist Party delivered few surprises from a leadership perspective, with President Xi securing a five year, or possibly longer, term in office. The President now faces a long list of trade deals and updated relations to negotiate in a quest to ensure continued export growth, which only improved by 2% annually in the past five years.

Source: Panjiva
]]>